Alert List Page
The Alert List Page is a full-page table of Ignition alarms: the page the operator works with alarms on. It has tabs for unacknowledged, active, shelved and historical alarms, a search field, paging, acknowledging of one or several alarms with a comment, and a detail panel for the selected alarm. It is found in the Embedding - OpenBridge section of the Perspective Component Palette as Alert List Page.
It reads the alarms from the gateway itself; no binding is needed. Put it on a
page of its own, typically /alarms, which is where the Alerts › button of
the Top Bar’s Alert Menu navigates to (alertPath). For
a compact list without a table, use the Alert List.
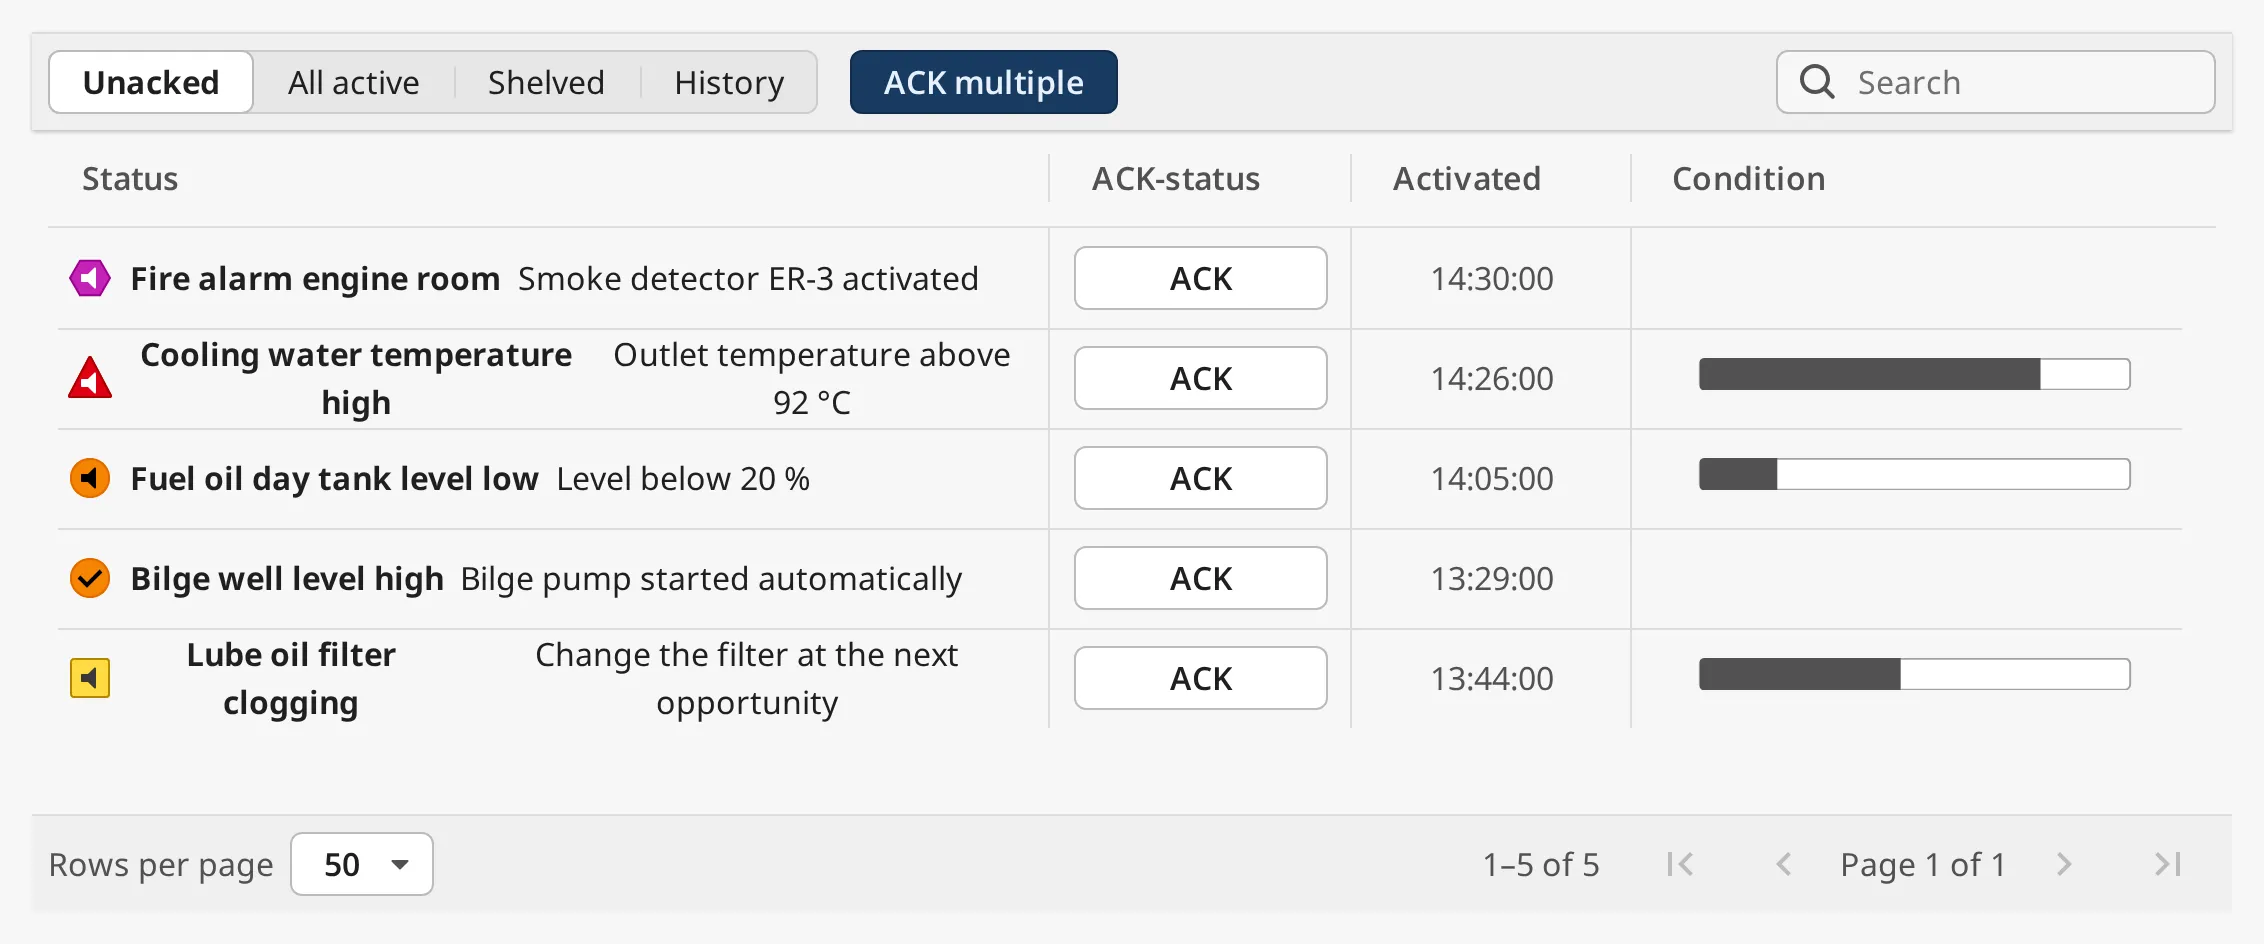
From top to bottom:
- Toolbar — the tabs, ACK multiple and the search field. See Tabs, Acknowledging and Search.
- Table — one row per alarm. See Columns.
- Footer — rows per page and the page buttons. See Paging.
Click a column header to sort. See Sorting.
Clicking a row opens the Detail Panel at the right.
An Alert List Page dropped from the palette is 800 × 400 px and shows the
Unacked tab. Give it the whole page: in a flex container set position.grow to
1. At 800 px the table is already narrow:
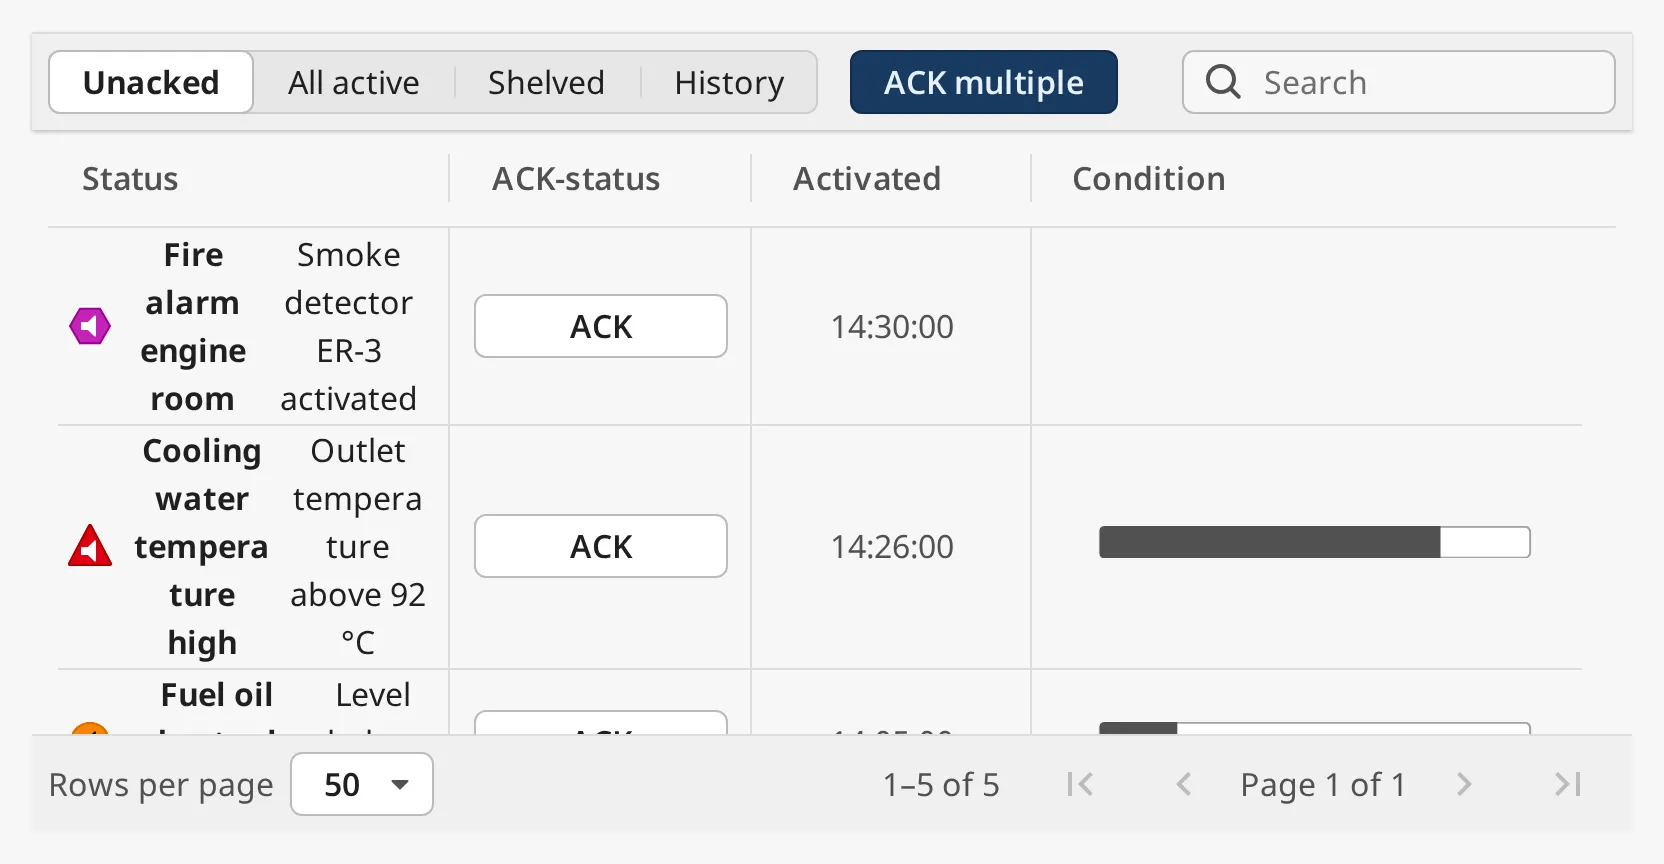
Note: The screenshots on this page were made with example alarms, not in a gateway session. The wide ones are scaled down to fit the page.
The tabs choose which alarms the table shows. Each tab is its own query on the gateway, not a filter on the rows already shown:
| Tab | mode |
Shows |
|---|---|---|
| Unacked | unacked |
Alarms that are not acknowledged, active or already cleared. |
| All active | active |
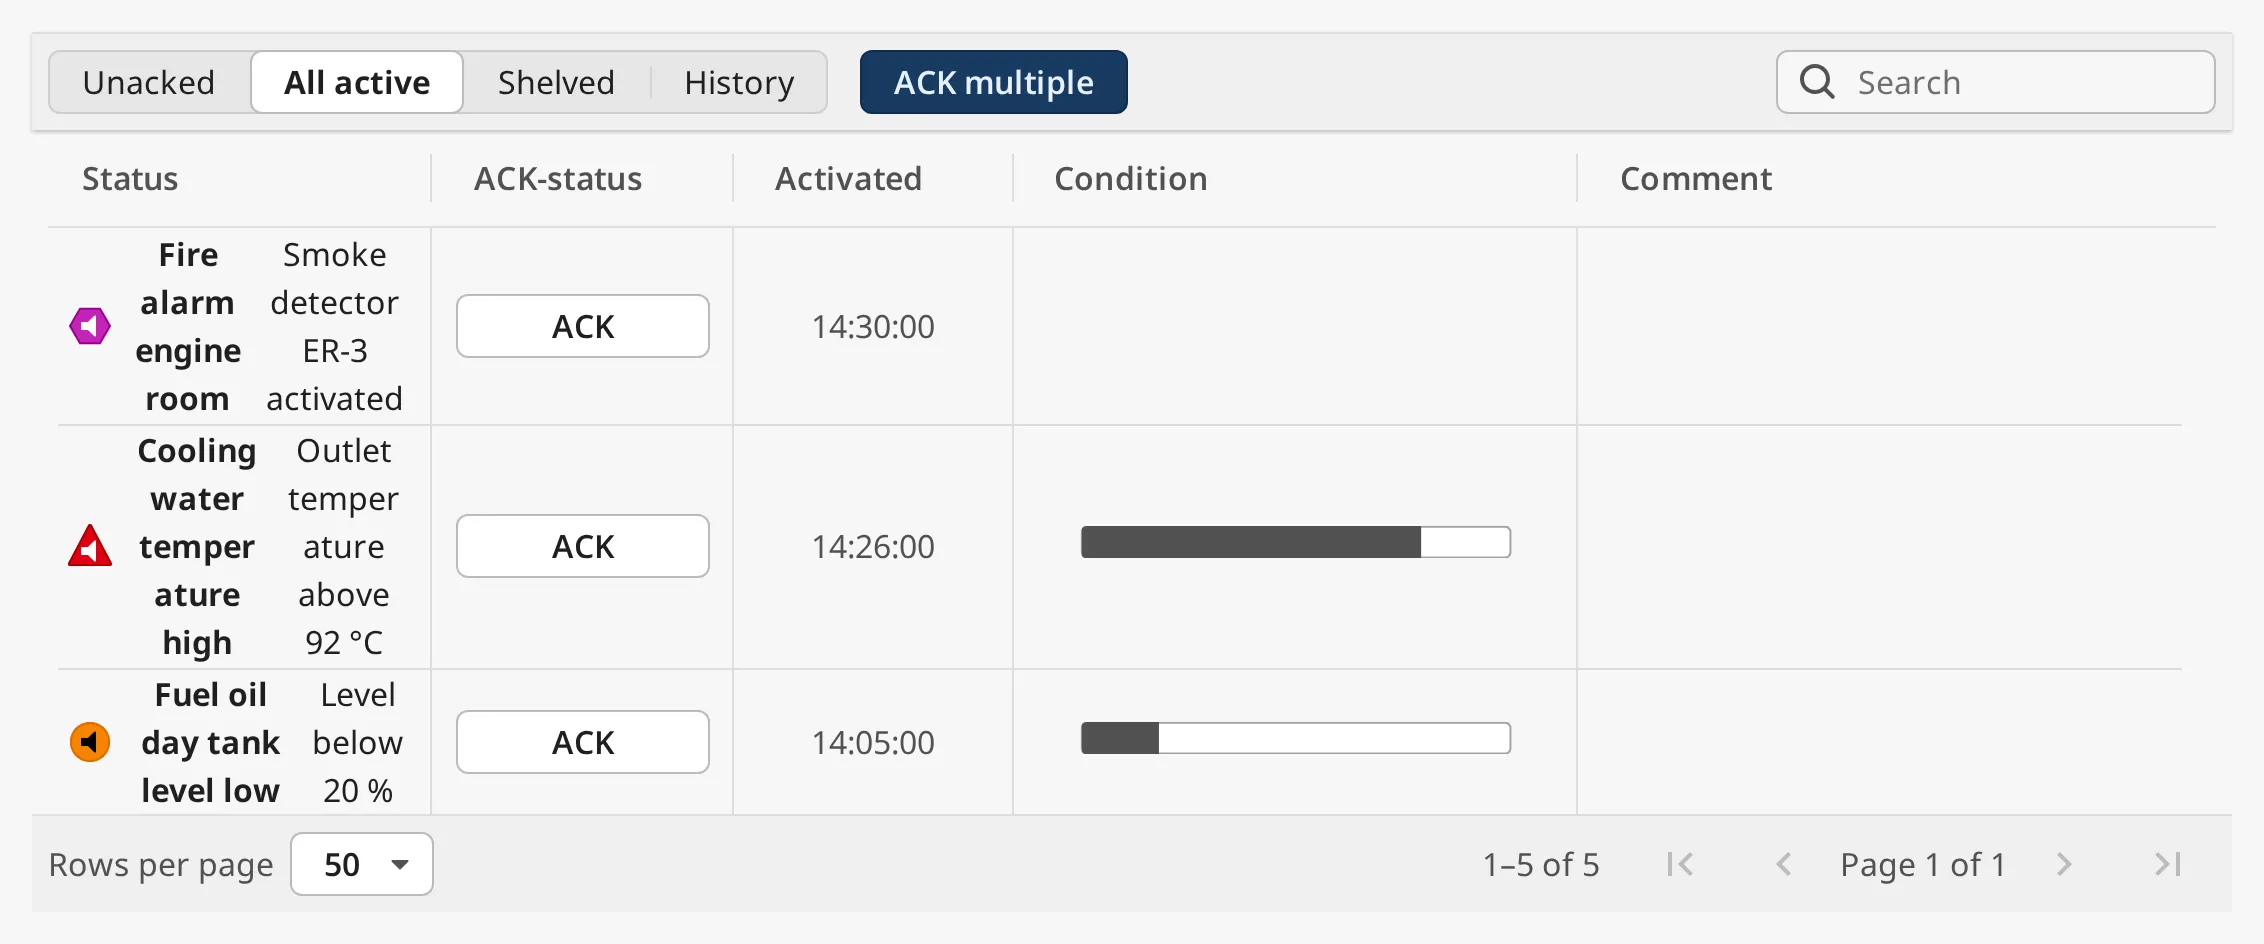
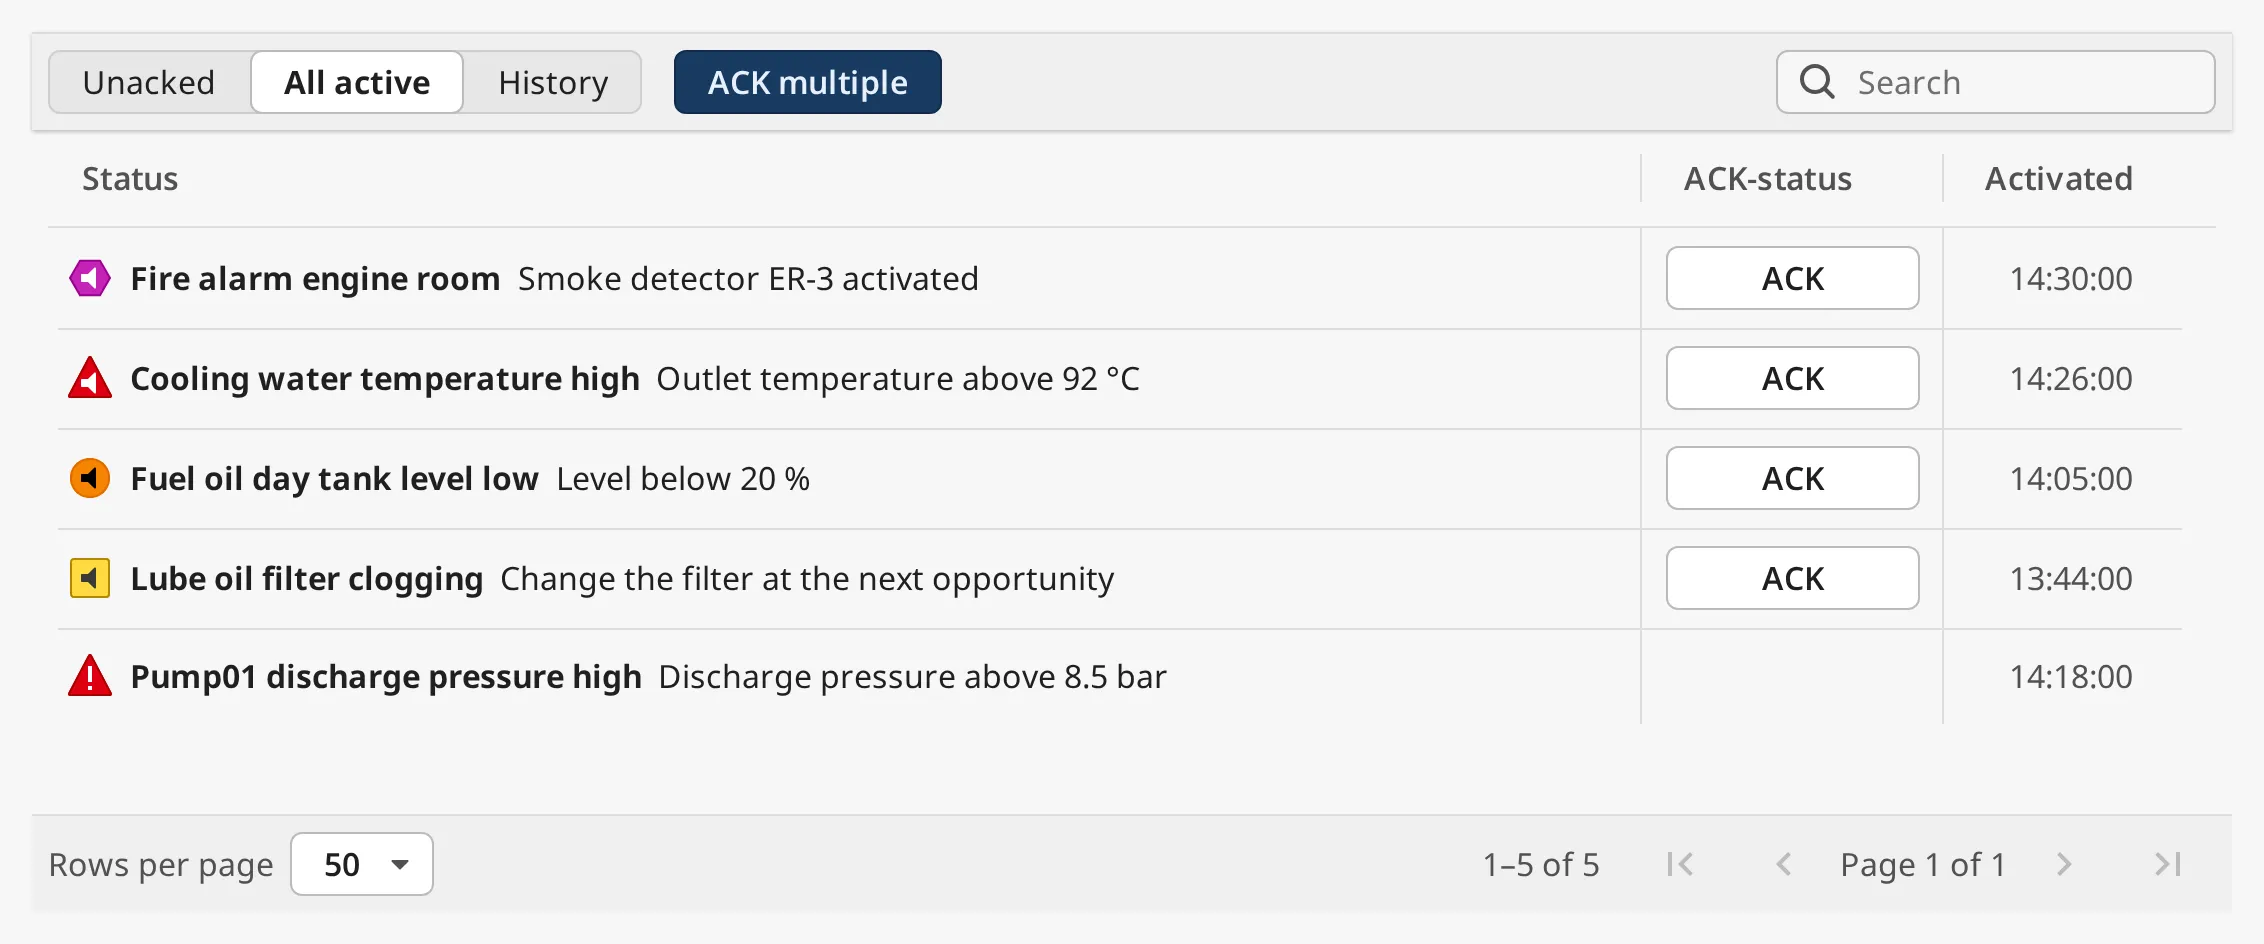
Alarms that are active, acknowledged or not. |
| Shelved | shelved |
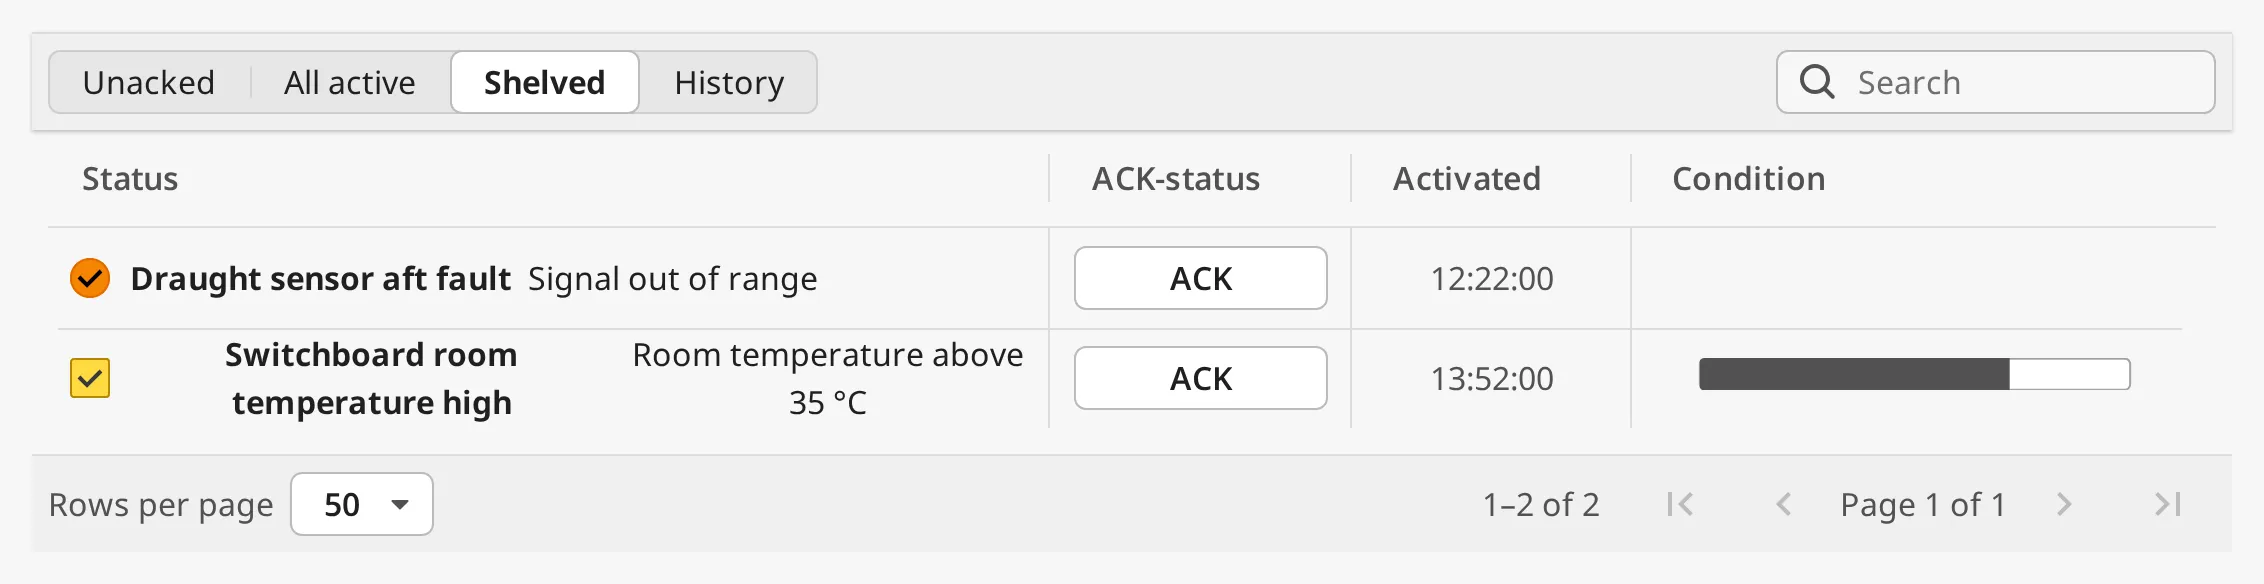
Alarms that are shelved and not both cleared and acknowledged. Hidden when canShelf is false. |
| History | history |
Alarms from the alarm journal of the last filter.historyLookbackHours hours, one row per alarm. |
The live tabs (Unacked, All active, Shelved) are updated every second. Their rows are sorted with unacknowledged alarms first, then by priority, highest first, then newest first. The History tab reads the alarm journal again every 30 seconds and when the tab is opened; its rows are sorted newest first.
All active:
Shelved:
History:
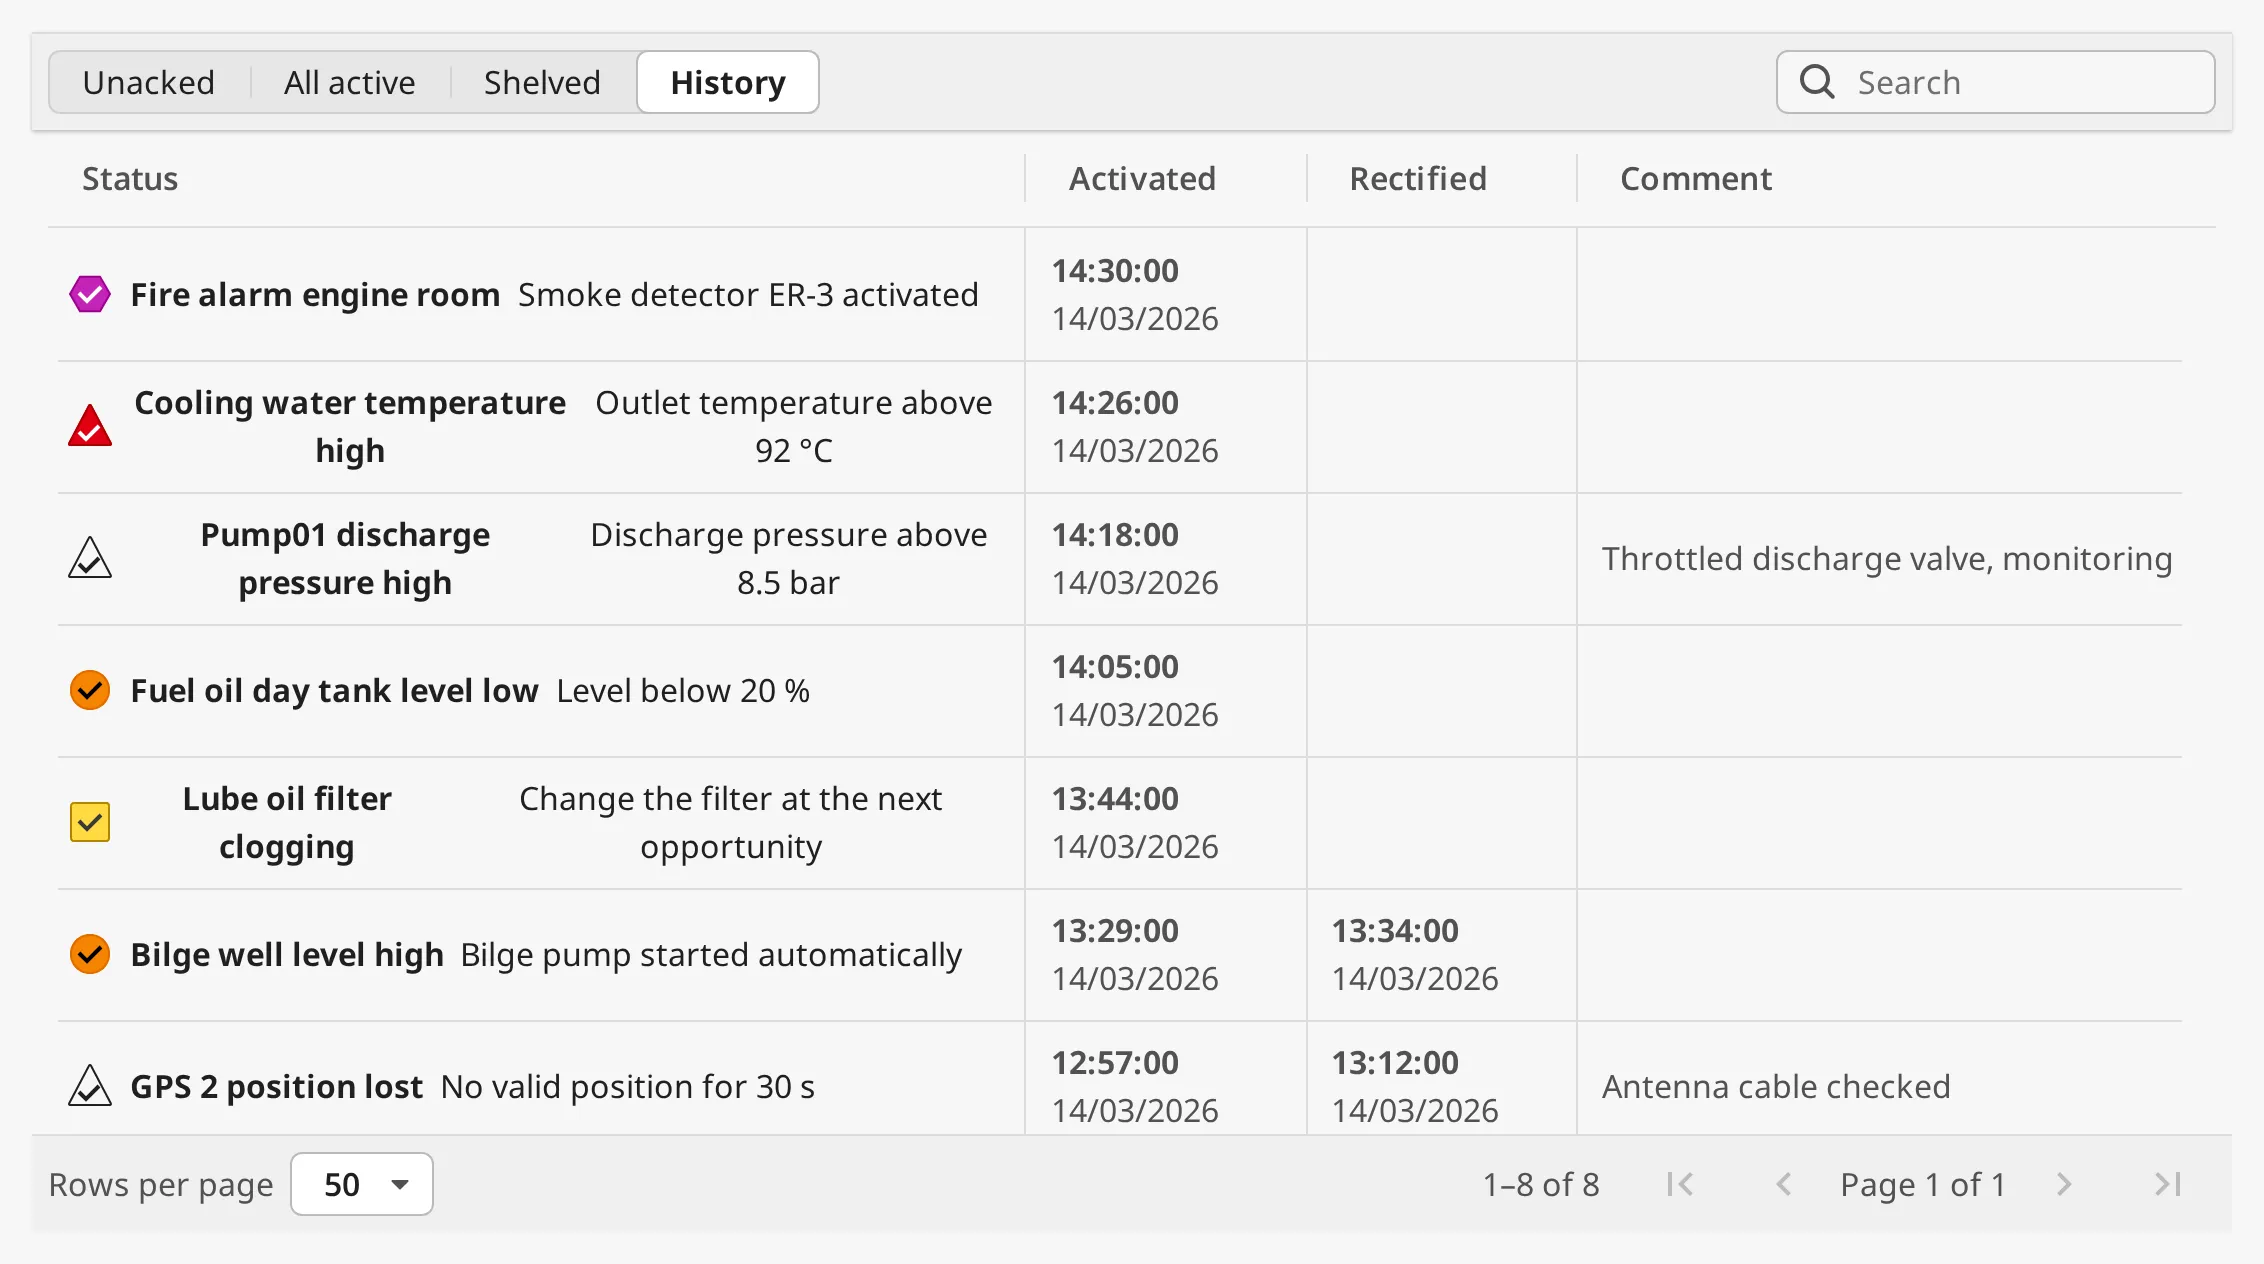
On the Shelved and History tabs every alert icon is drawn as not active.
The selected tab is written to mode, and changing mode from a binding or a
script switches the tab, so the page can be opened on a given tab. Switching tab
clears the selection, the search and the page number.
History and the Alarm Journal
Section titled “History and the Alarm Journal”The History tab needs an alarm journal on the gateway. filter.journalProfile
names the journal to read; when it is empty, the first journal the gateway
reports is used, which is right for a gateway with one journal.
When History has no journal to read, a warning above the table says why instead
of showing an empty list that looks as if no alarms happened: either the gateway
has no alarm journal, or filter.journalProfile names a journal the gateway
does not have. Configure a journal on the gateway or correct the name.
The journal stores a record for every change of an alarm (active, acknowledged, cleared). The table shows one row per alarm, with the time it became active, the time it was cleared (Rectified, empty while it is still active) and the acknowledge comment.
Filter
Section titled “Filter”The filter property narrows every tab by priority and path, in the same way as
the Top Bar’s filter (see
Which Alarms Are Shown). Unlike the Top Bar
and the Alert List, it has no states: the tab decides the states.
Properties
Section titled “Properties”| Name | Description | Property Type |
|---|---|---|
| mode | The selected tab: unacked, active, shelved or history. Written by the tabs. Default unacked. |
value |
| filter | Gateway-side alarm filter. See the sub-properties below. | object |
filter sub-properties:
| Name | Description | Property Type |
|---|---|---|
| priorities.diagnostic | Include diagnostic alarms. Default false. |
value |
| priorities.low | Include low alarms. Default true. |
value |
| priorities.medium | Include medium alarms. Default true. |
value |
| priorities.high | Include high alarms. Default true. |
value |
| priorities.critical | Include critical alarms. Default true. |
value |
| conditions.source | Alarm source path filter. Comma-separated, * wildcard. Default *. |
value |
| conditions.displayPath | Display path filter (falls back to source path). Comma-separated, * wildcard. Default *. |
value |
| conditions.provider | Alarm provider filter. Comma-separated. Empty means all providers. | value |
| journalProfile | Alarm journal the History tab reads. Empty means the first journal on the gateway. Default empty. | value |
| historyLookbackHours | How many hours back the History tab reads. Default 24, at most 8784 (366 days). |
value |
Columns
Section titled “Columns”| Column | Shows |
|---|---|
| Status | The alert icon, the title and the description. The Alert List page explains the icons and the fields titleSource and descriptionSource can show. |
| ACK-status | An ACK button on each alarm that can be acknowledged. Not on the History tab. |
| Activated | When the alarm became active. |
| Rectified | When the alarm was cleared. History tab only. |
| Condition | The tag’s current value as a bar between its engineering low and high. Not on the History tab, and hidden while the detail panel is open. Empty when the tag has no numeric value or no engineering limits. |
| Comment | The acknowledge comment. All active and History tabs only, and hidden while the detail panel is open. |
The Condition column and the Comment column can be turned off:
showCondition=falsehides the Condition column and the trend in the detail panel. The gateway then stops reading the alarms’ tags.canComment=falsehides the Comment column, the comment field when acknowledging several alarms, and the comment in the detail panel.
With canShelf, canComment and showCondition all false:
dateFormat sets the Activated column on the live tabs; historyDateFormat
sets the Activated and Rectified columns on the History tab and the times in the
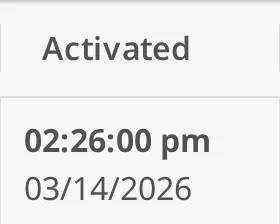
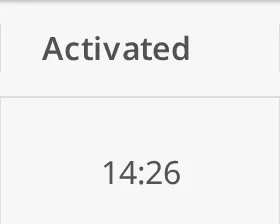
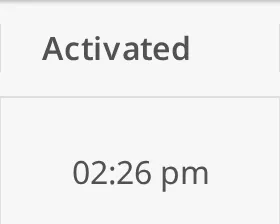
detail panel. A format with a date shows the time with the date under it:
dateFormat |
Image |
|---|---|
HH:mm:ss |
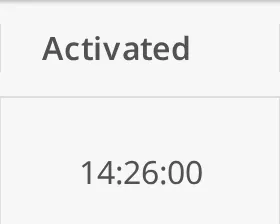 |
DD/MM/YYYY HH:mm:ss |
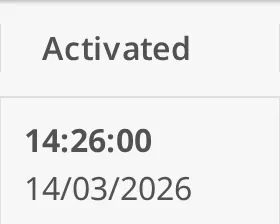 |
MM/DD/YYYY hh:mm:ss a |
 |
HH:mm |
 |
hh:mm a |
 |
historyDateFormat offers the same values; its default is
DD/MM/YYYY HH:mm:ss, so rows from different days can be told apart.
Custom Columns
Section titled “Custom Columns”To add columns of your own, for instance where on the vessel the alarm’s equipment is, configure the getCustomColumns extension function on the component. It is called for every row of the current page each time the table is updated, with:
alert— the Ignition alarm event of the row,tagPath— the path of the tag the alarm is on (Nonewhen the alarm has no tag);tagPath.toStringFull()gives for example[default]Ballast/Pump01/DischargePressure.
Return a dictionary of column name to value (text or number). The columns are added after the built-in ones, in the order they first appear; a row that does not return a column leaves its cell empty.
def getCustomColumns(self, alert, tagPath): if tagPath is None: return {} # '[default]Ballast/Pump01/DischargePressure' -> 'Ballast' system = tagPath.toStringFull().split(']')[-1].split('/')[0] return {'System': system, 'Priority': str(alert.priority)}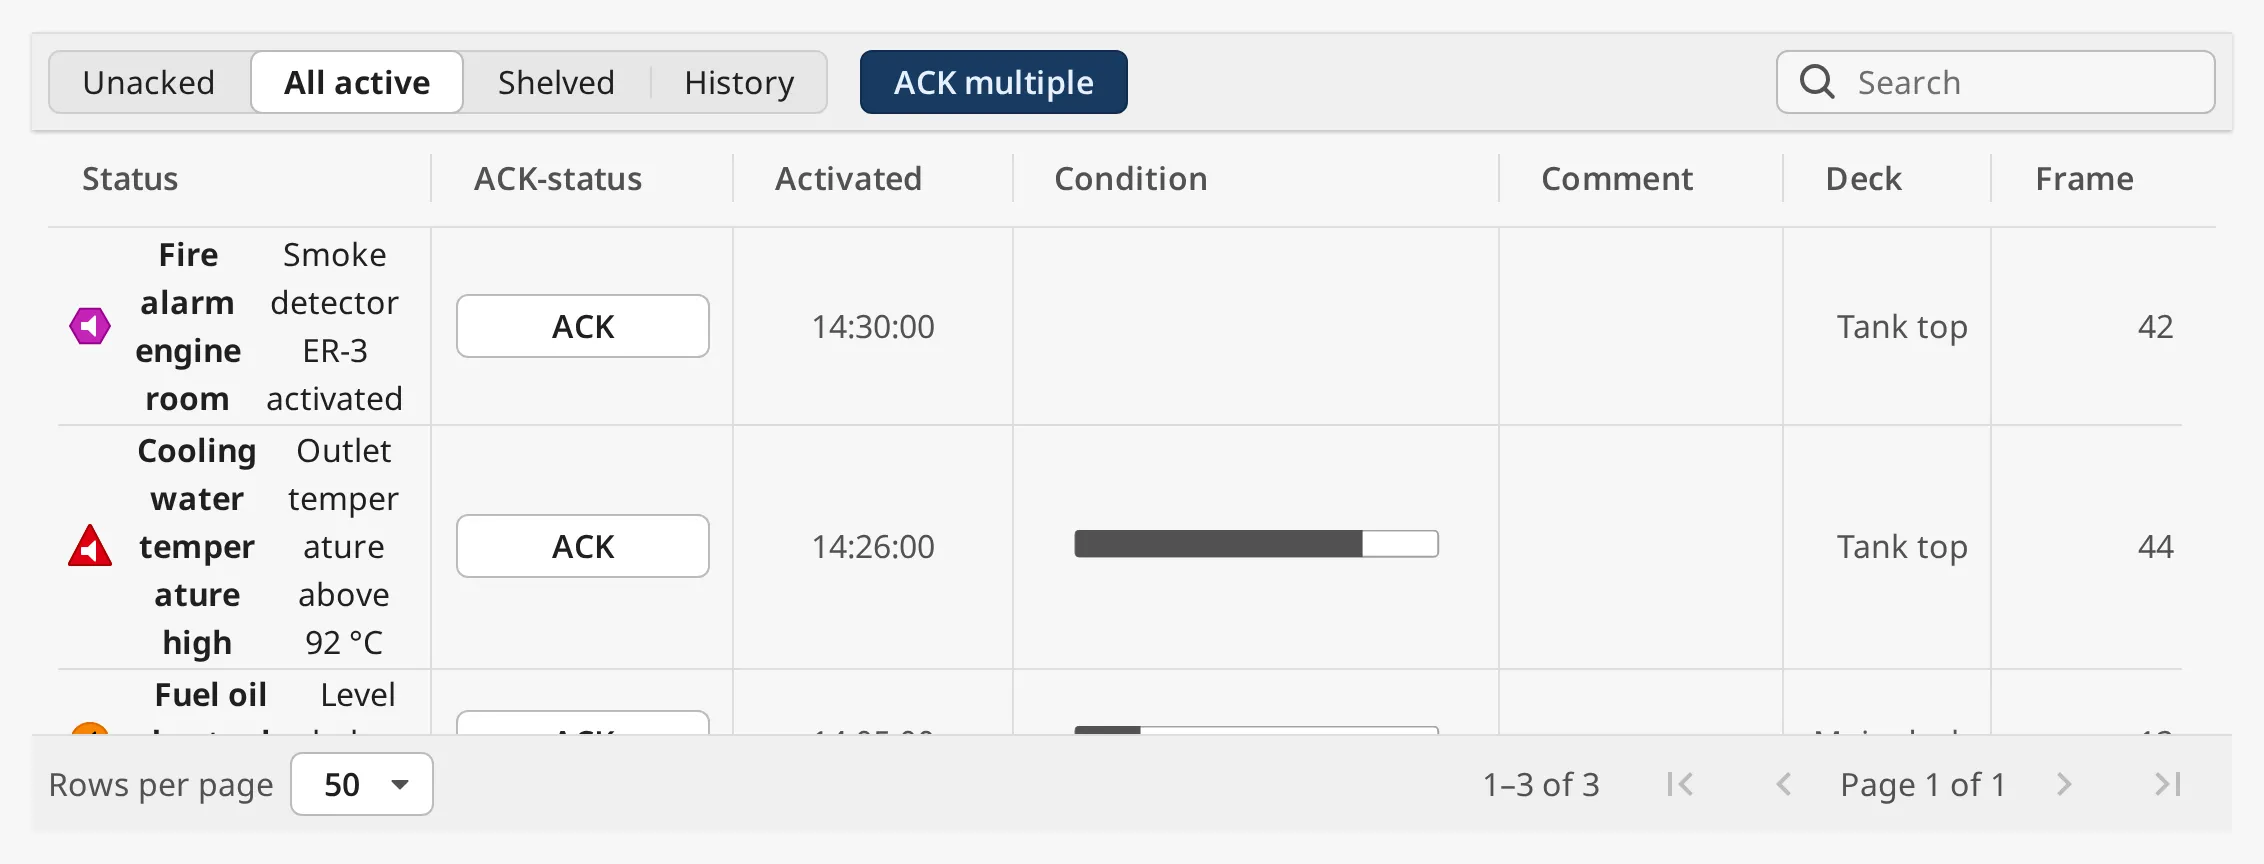
Keep the function fast: it runs for every row, every second.
Properties
Section titled “Properties”| Name | Description | Property Type |
|---|---|---|
| titleSource | Alarm field shown as the row title and the detail panel’s title: label, name, notes or displayPath. Default label. |
value |
| descriptionSource | Alarm field shown as the row description and the detail panel’s description. Default notes. |
value |
| dateFormat | Time format of the live tabs. Default HH:mm:ss. |
value |
| historyDateFormat | Time format of the History tab and the detail panel. Default DD/MM/YYYY HH:mm:ss. |
value |
| showTimeInUtc | Show times in UTC instead of the local time zone. Default false. |
value |
| showCondition | Show the Condition column and the detail panel’s trend. Default true. |
value |
| canComment | Use acknowledge comments: the Comment column, the comment when acknowledging several alarms, and the detail panel’s comment. Default true. |
value |
Acknowledging
Section titled “Acknowledging”One Alarm
Section titled “One Alarm”Click ACK in the row. The alarm is acknowledged on the gateway in the name
of the signed-in user, without a comment, and
onAcknowledgeClick fires. To add a comment, acknowledge
from the Detail Panel instead.
Which alarms get an ACK button follows alertConvention, as on the Top Bar
(see Acknowledging): with bam, low and diagnostic
alarms have none.
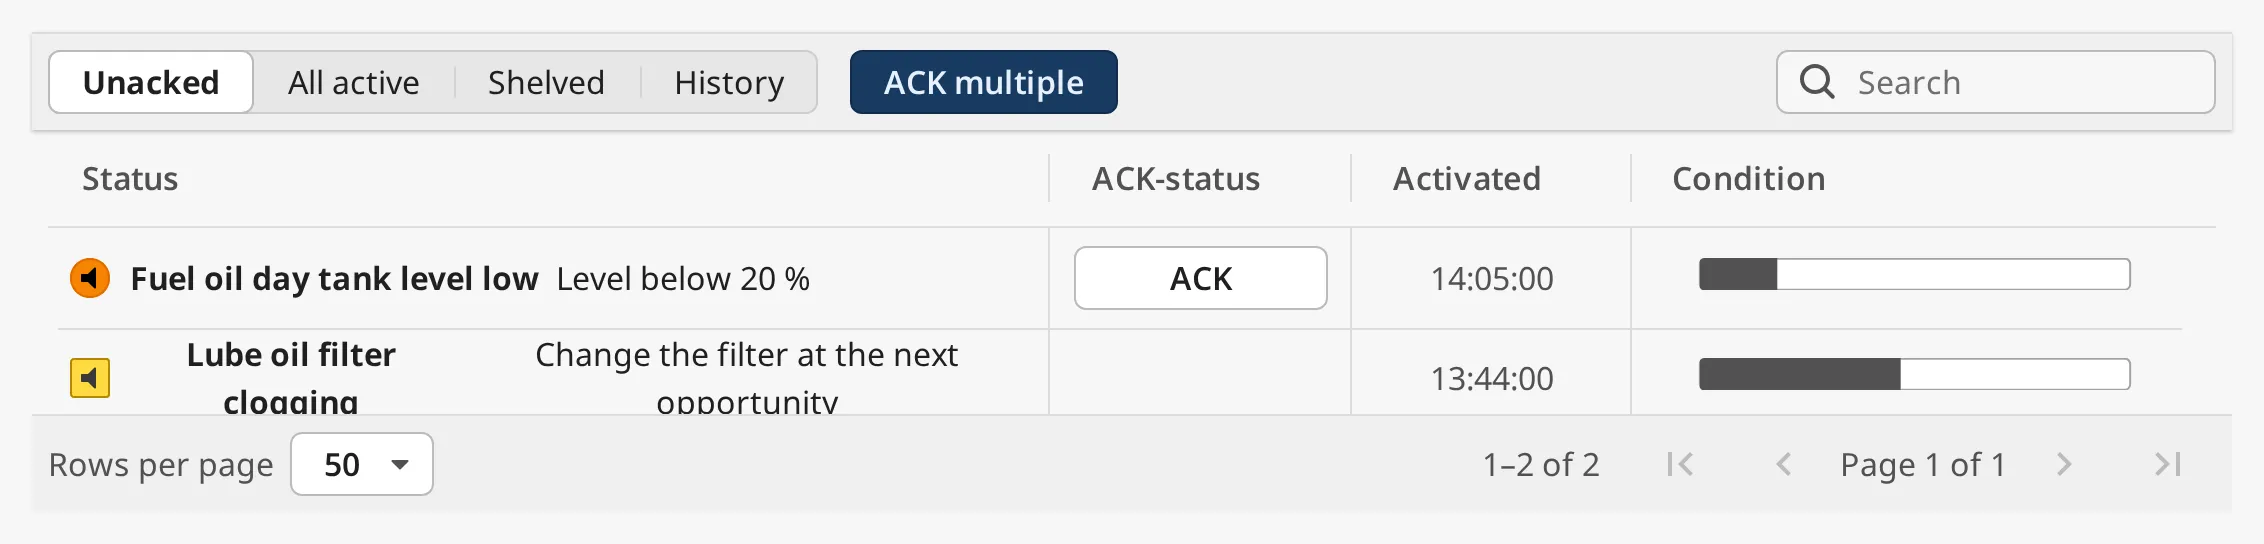
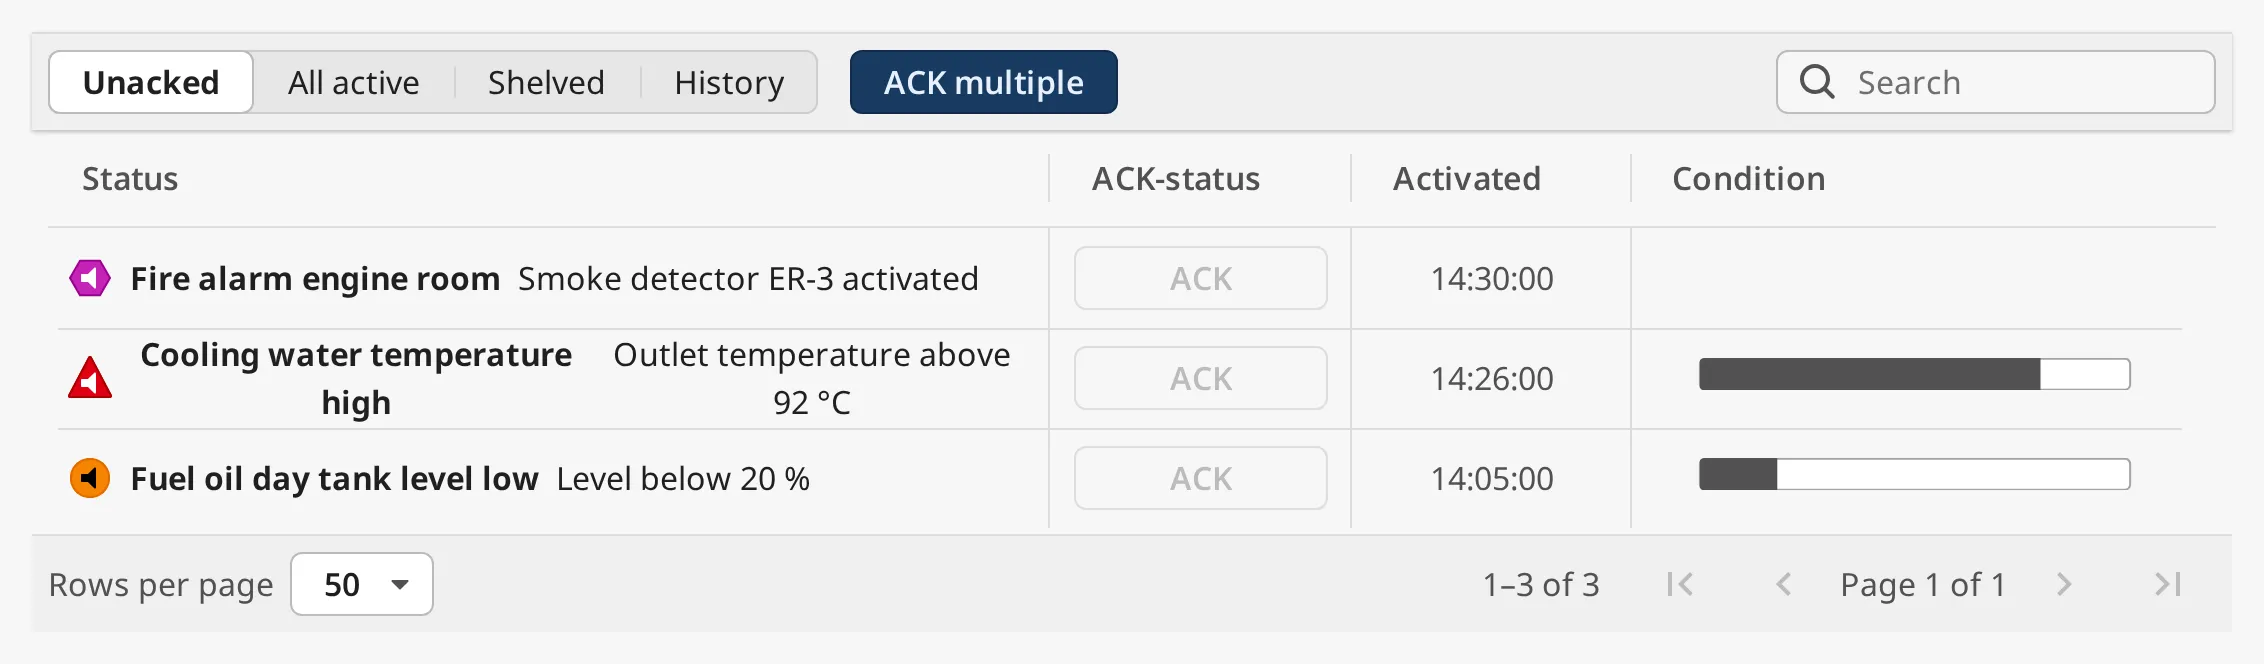
With canAcknowledge set to false the ACK buttons are disabled, and the
gateway refuses acknowledge requests from this component:
Several Alarms
Section titled “Several Alarms”On the Unacked and All active tabs, ACK multiple switches the toolbar to selection:
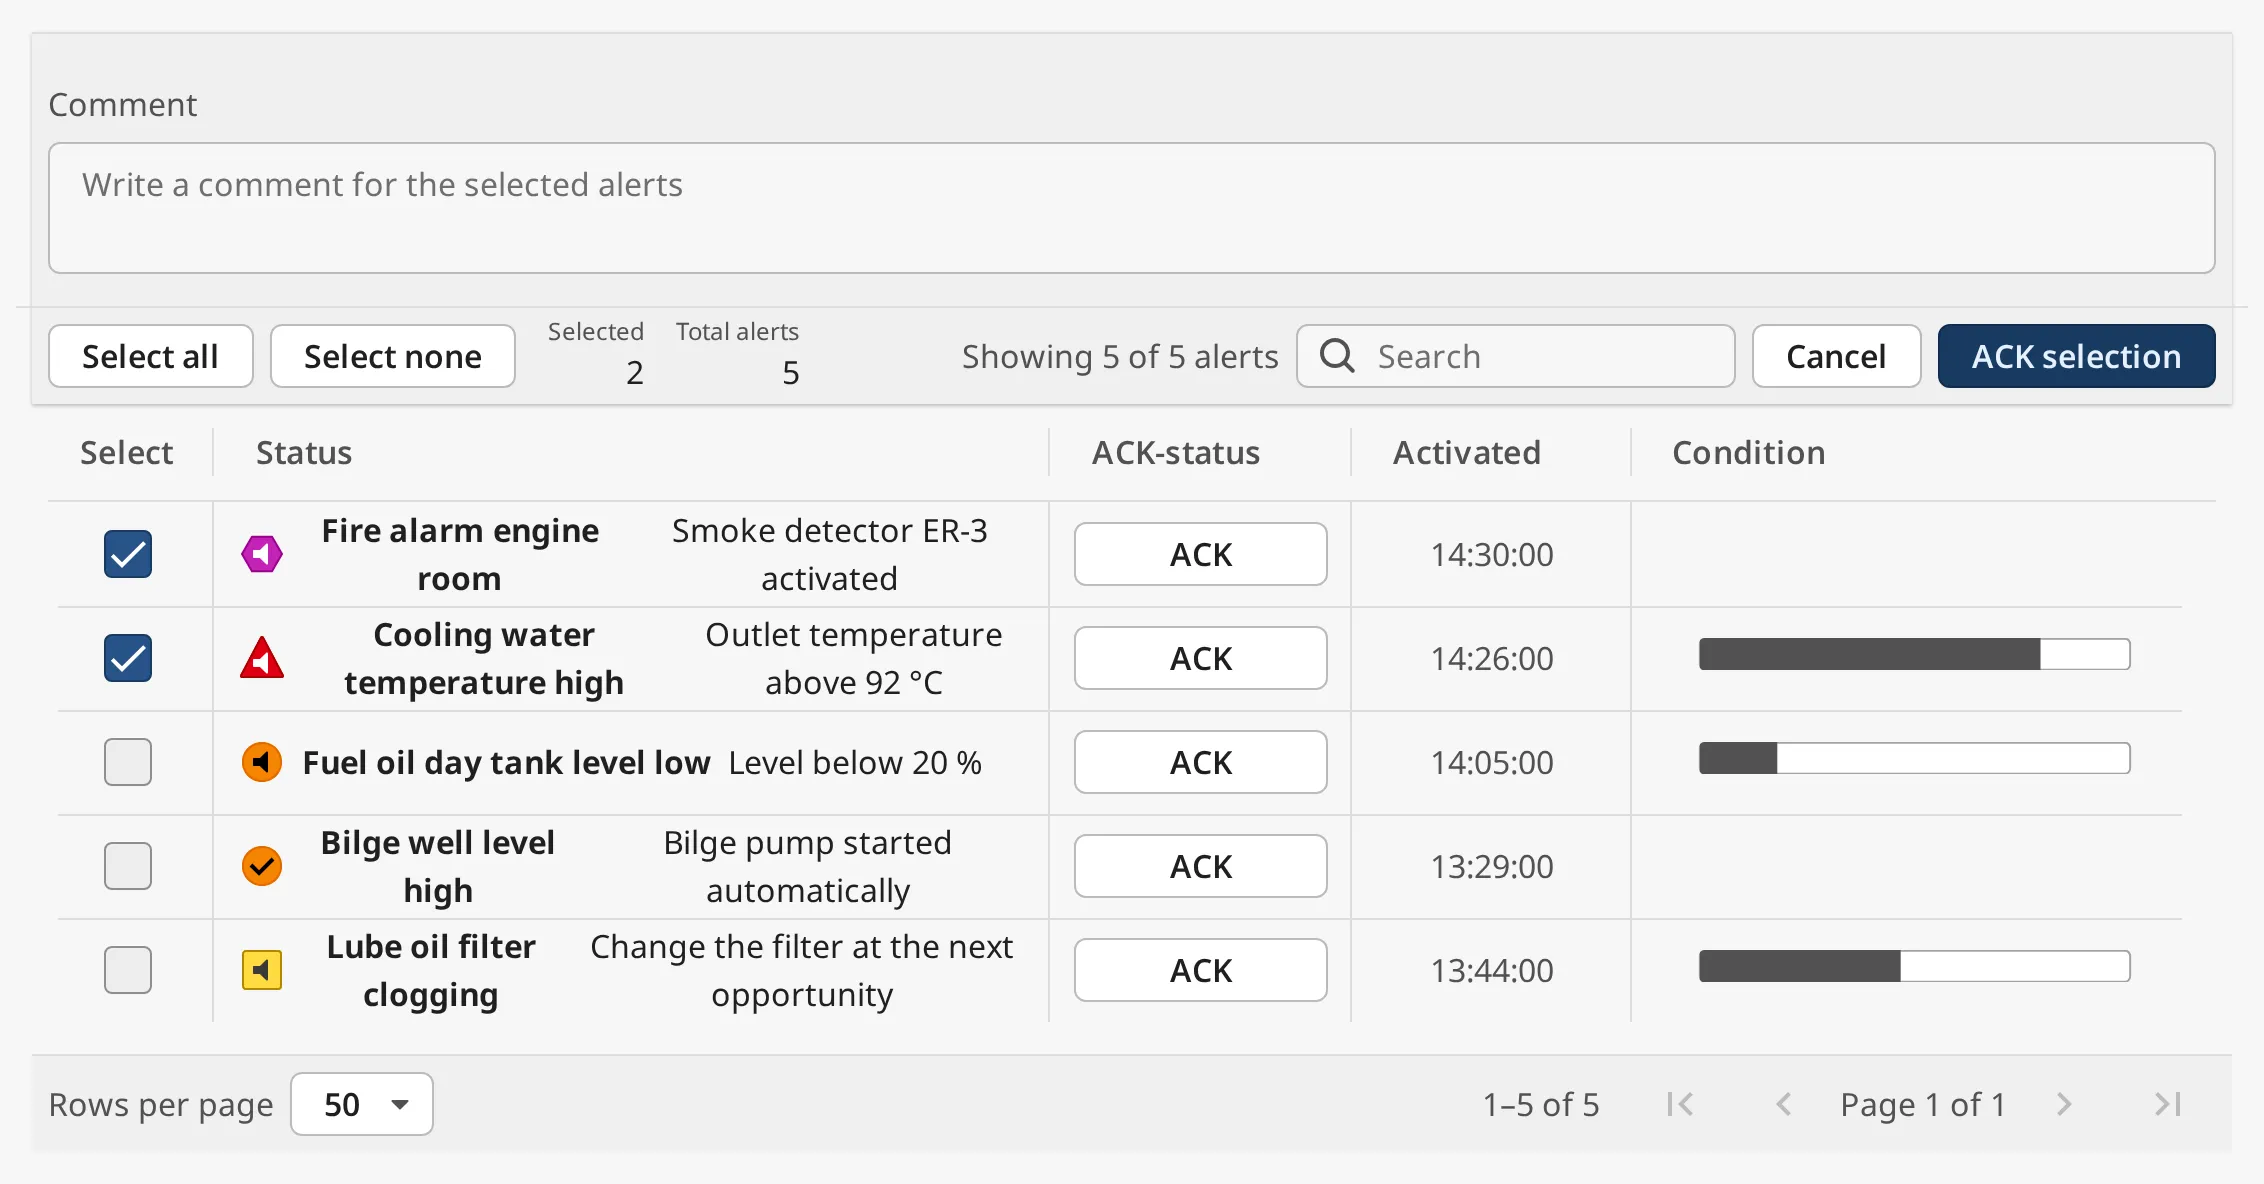
- Tick the alarms in the new Select column, or click Select all to select every alarm on the current page that can be acknowledged. Select none clears the selection.
- Optionally write a Comment; it is stored with every selected alarm.
- Click ACK selection. Cancel leaves without acknowledging.
After ACK selection the toolbar stays in selection mode, with the selection and comment cleared, so you can go on acknowledging. It returns to the normal toolbar once the list has no alarms left to acknowledge.
onAcknowledgeClick fires once for every acknowledged alarm.
Properties
Section titled “Properties”| Name | Description | Property Type |
|---|---|---|
| canAcknowledge | Whether the operator may acknowledge. When false the ACK buttons are disabled and the gateway rejects acknowledging. Default true. |
value |
| alertConvention | Which alarms can be acknowledged: levels or bam. Default levels. |
value |
Search
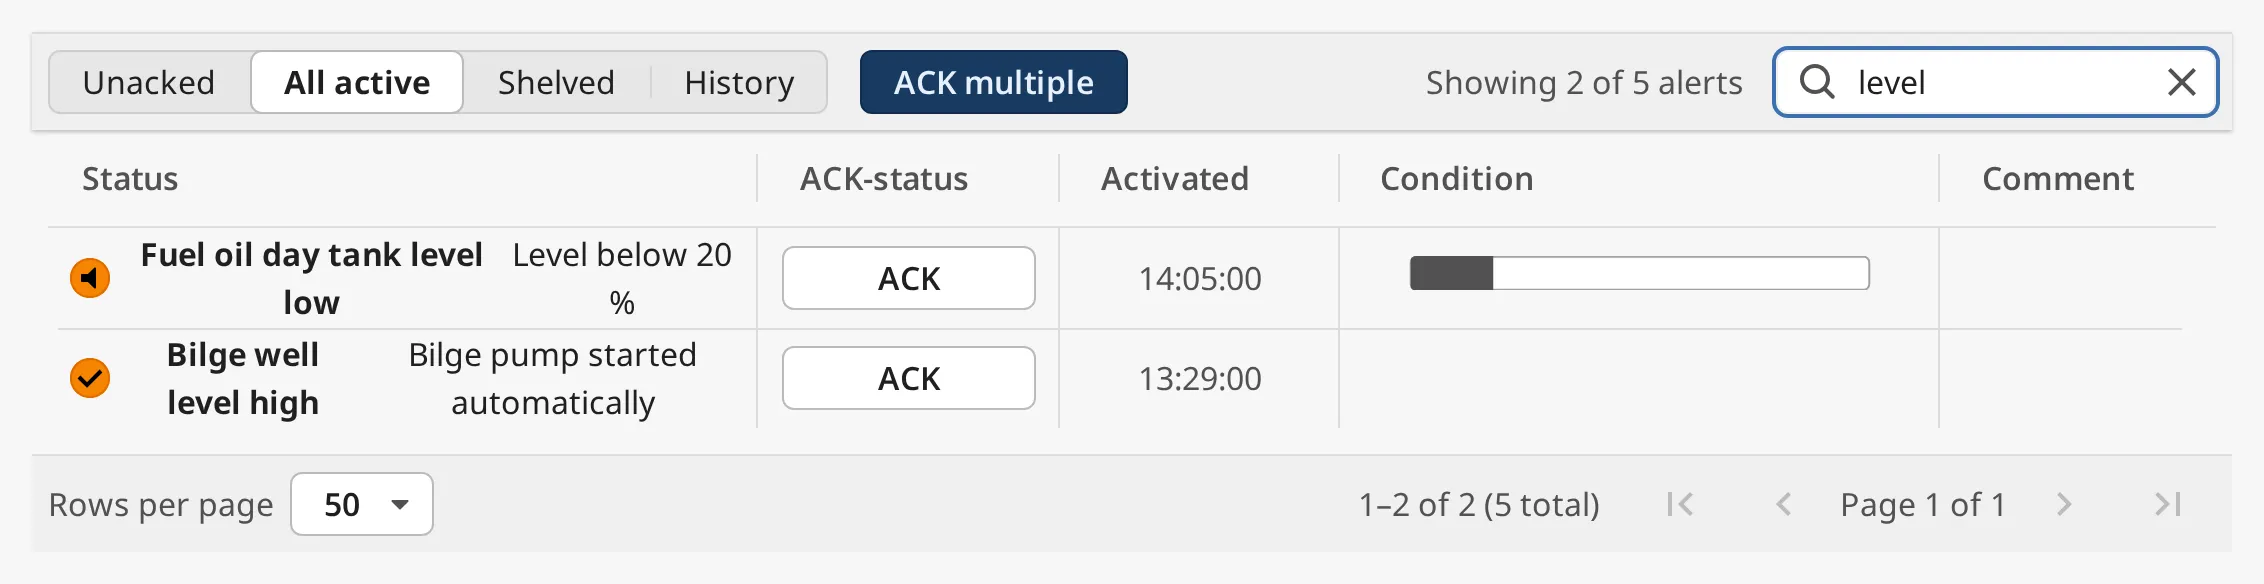
Section titled “Search”Type in the search field to show only the alarms whose name, label, notes, display path or acknowledge comment contain the text, upper or lower case. The search runs on the gateway over all alarms of the tab, not only the current page, and the toolbar shows how many match:
Sorting
Section titled “Sorting”Click a column header to sort by it, and click it again to reverse the order. The arrow in the header shows the column and direction. Every column except Condition can be sorted:
| Column | Sorts by |
|---|---|
| Status | Priority. Descending puts the highest priority first. |
| ACK-status | Ascending puts unacknowledged alarms first. |
| Activated | When the alarm became active. |
| Rectified | When the alarm was cleared. Alarms not yet cleared come last. |
| Comment | The acknowledge comment, A–Z. Alarms without a comment come last. |
| Custom columns | The shown value; numbers in numeric order. |
Sorting is done in the browser and orders the rows of the current page. The gateway decides which alarms are on each page: unacknowledged first, then the highest priority, then the newest, and on the History tab the newest first. The sort stays while the list updates, and is reset when the tab or the set of columns changes.
Paging
Section titled “Paging”The gateway sends one page of alarms at a time, so a vessel with thousands of alarms does not slow down the browser. The footer shows which rows are shown (with the total in brackets while a search is active), Rows per page (10, 25, 50 or 100) and buttons for the first, previous, next and last page:

Both are written back to the component: the page to page, the page size to
pageSize. Changing the page size, the tab or the search goes back to page 1.
Properties
Section titled “Properties”| Name | Description | Property Type |
|---|---|---|
| pageSize | Rows per page, 1–200. Written by Rows per page. Default 50. |
value |
| page | The current page, starting at 1. Written by the page buttons. Default 1. |
value |
Detail Panel
Section titled “Detail Panel”Clicking a row selects it, writes its event id to selectedEventId and fires
onItemClick. The detail panel opens at the right of
the table, 360 px wide, with the details of the alarm, the trend of its tag, the
comment, Acknowledge, Shelve and Go to. It is the
Alert Detail component built in; that page describes its
content and buttons. The ✕ in the panel closes it and clears
selectedEventId.
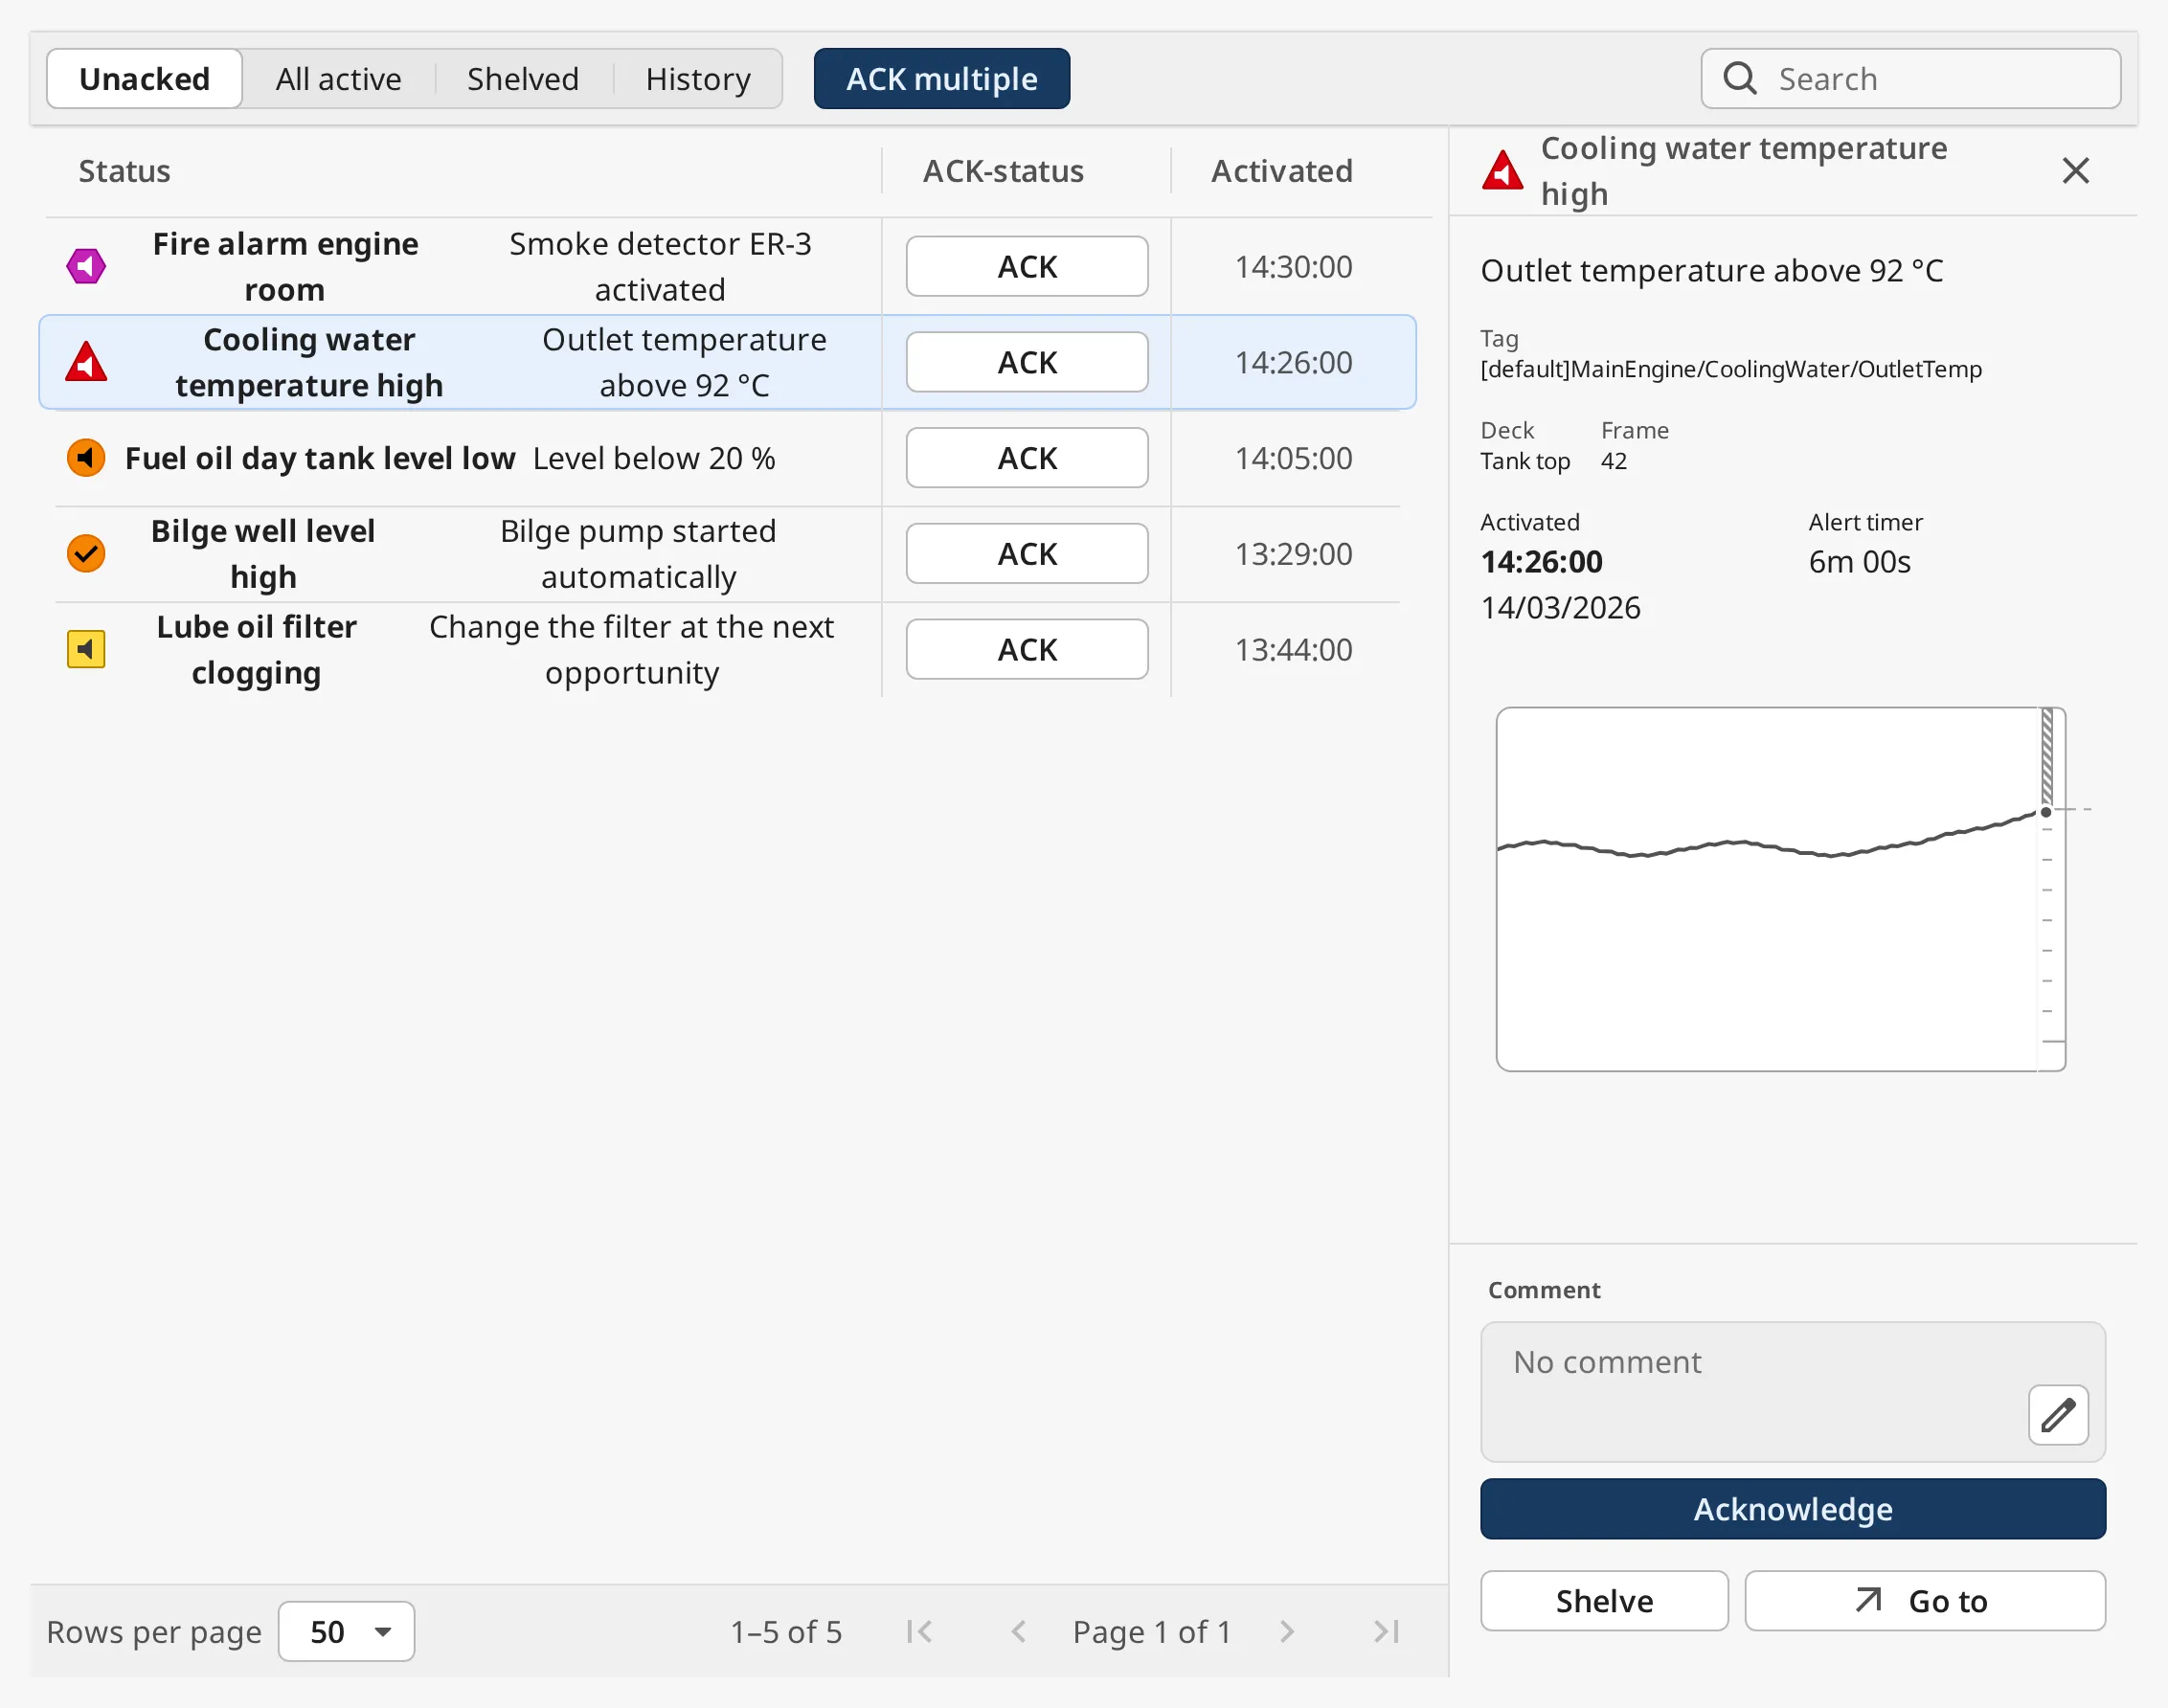
The panel takes room from the table, so give the page enough width.
An alarm that is no longer in the alarm status, because it cleared and was
acknowledged, is looked up in the alarm journal named by
filter.journalProfile, within the last filter.historyLookbackHours hours.
This applies on every tab, so the panel keeps showing an alarm that the
operator acknowledged from it.
selectedEventId is cleared when the operator changes tab. A value set in the
view, by a view parameter or by a binding opens the page with that alarm’s
panel open.
While the panel is open, the Condition and Comment columns are hidden: the panel shows the trend and the comment, and the table keeps its room for the status text.
Like the Alert Detail, the panel uses the getCustomData and getNextUrl extension functions to show extra fields and the Go to button. They work as described in Custom Fields and Go To, but are configured on the Alert List Page.
canShelf = false hides the Shelved tab and the panel’s Shelve
button, and the gateway refuses shelving from this component. If mode is
shelved when shelving is turned off, the page switches to the Unacked tab.
Properties
Section titled “Properties”| Name | Description | Property Type |
|---|---|---|
| selectedEventId | Event id (UUID) of the alarm in the detail panel. Written when a row is clicked; empty closes the panel. Default empty. | value |
| canShelf | Whether shelving is available: the Shelved tab and the panel’s Shelve button. Default true. |
value |
| historyWindowSeconds | How much tag history the panel’s trend shows, in seconds. Default 10800 (3 hours), at most 2678400 (31 days). |
value |
| historyPollSeconds | How often the trend is read again, in seconds. Default 30, at least 1. |
value |
Properties
Section titled “Properties”| Name | Description | Property Type |
|---|---|---|
| style | Standard Perspective style object. | object |
Extension Functions
Section titled “Extension Functions”| Function | Called | Returns |
|---|---|---|
| getCustomColumns | For every row, each time the table is updated. | A dictionary of column name to value. See Custom Columns. |
| getCustomData | For the selected alarm, every 30 s by default. | Rows of extra fields for the detail panel. See Custom Fields. |
| getNextUrl | For the selected alarm, every 30 s by default. | The page Go to opens, or None. See Go To. |
Component Events
Section titled “Component Events”| Event | Description | Event Object |
|---|---|---|
| onItemClick | Fired when the operator clicks a row, after its event id is written to selectedEventId. |
See below |
| onAcknowledgeClick | Fired when the operator acknowledges with ACK in a row, and once per alarm with ACK selection. Not fired by the detail panel’s Acknowledge. | See below |
Both events tell which alarm it was:
| Name | Description | Property Type |
|---|---|---|
| alarmId | The alarm’s event id (UUID). | value |
| alarmName | The alarm name, or empty if the alarm is no longer in the list. | value |
Examples
Section titled “Examples”Example 1 — The Alarm Page of the Top Bar
Section titled “Example 1 — The Alarm Page of the Top Bar”- Create a view
Alarmswith a flex container root (directioncolumn), and add an Alert List Page withposition.grow=1. - In Page Configuration, add the page
/alarmswith the viewAlarms. - On the Top Bar, leave
alertPathat/alarms. The Alerts › button of its Alert Menu now opens this page.
Example 2 — Open the Page on the History Tab
Section titled “Example 2 — Open the Page on the History Tab”- In Page Configuration, add the page
/alarms/:tabwith the viewAlarms, and give the view a parametertab. - Bind
modeon the Alert List Page toview.params.tab. - Navigate to
/alarms/history, for example withsystem.perspective.navigate('/alarms/history').
The operator can still change tab; the binding only sets the tab when the page opens.
Example 3 — Only the Alarms of the Engine Room
Section titled “Example 3 — Only the Alarms of the Engine Room”Set filter.conditions.displayPath to Engine room/*,Main engine/*. Every tab,
including History, now shows only alarms whose display path starts with one of
the two.
Found an error or something unclear?
Tell us what is wrong, confusing or missing on this page.
Built on the OpenBridge Design System