Donut Chart
The Donut Chart shows how a total is made up of parts, as segments of a ring, with the sum of the parts in the centre. Use it for shares of a capacity, such as how the available power of MS Nordkapp is used by propulsion, hotel and thrusters. It is found in the Chart - OpenBridge section of the Perspective Component Palette as Donut Chart (Beta).
Note: This component is in beta: its properties may change in a later version.
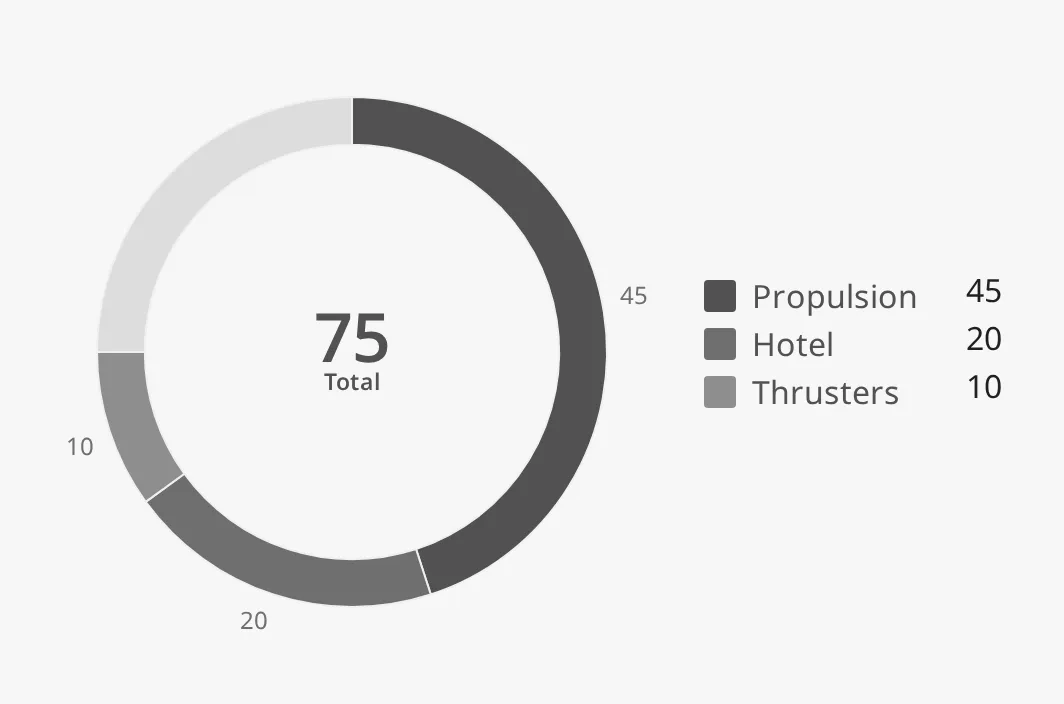
- Segments — one per item in
data, in order, clockwise from the top. See Data. - Remaining sector — the part of
maxthat the segments do not fill. See Max. - Centre readout — the sum of all values, with a label and an optional unit. See Centre Readout.
- Outer labels — the value of each segment beside it. See Outer Labels.
- Legend — the name and value of each segment. See Legend.
A Donut Chart dropped from the palette has no data and shows an empty ring with
the total 0. The blue frame is the component’s box:
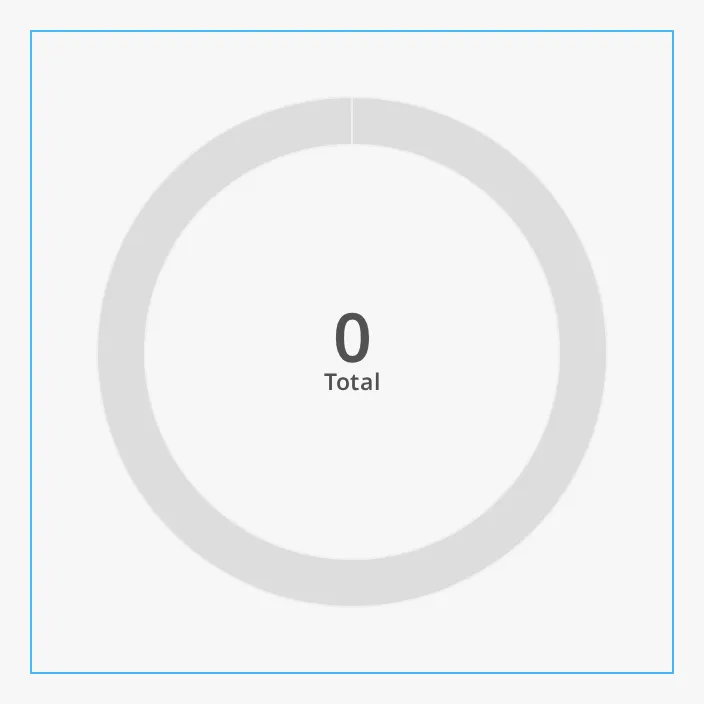
The chart is drawn at a fixed size, set by fixedHeight, and does not
follow the size of the component’s box.
data is a list of segments. Each segment is an object with a label (the
name, shown in the legend and the tooltip) and a value (a number):
[ {"label": "Propulsion", "value": 45}, {"label": "Hotel", "value": 20}, {"label": "Thrusters", "value": 10}]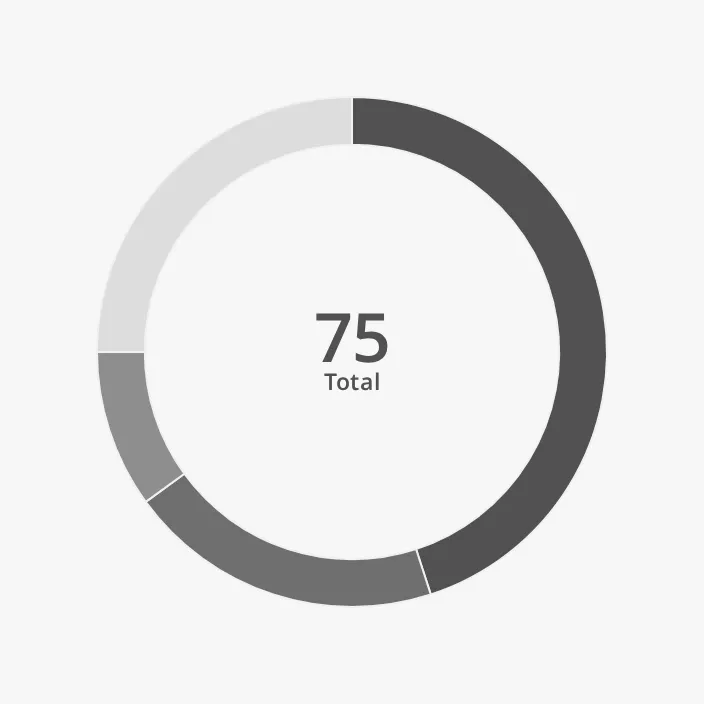
The segments are drawn in the order of the list, clockwise from the top. A list
of plain numbers ([45, 20, 10]) is not understood: the ring stays empty and
the total is 0.
To show live values, build the list in the Designer and bind each value to a
tag, for example data[0].value to [default]Power/Propulsion. To build the
whole list from a script or a query, use a binding with a script transform that
returns a list of {"label": ..., "value": ...} objects.
Hovering over a segment shows its label and value in a tooltip:
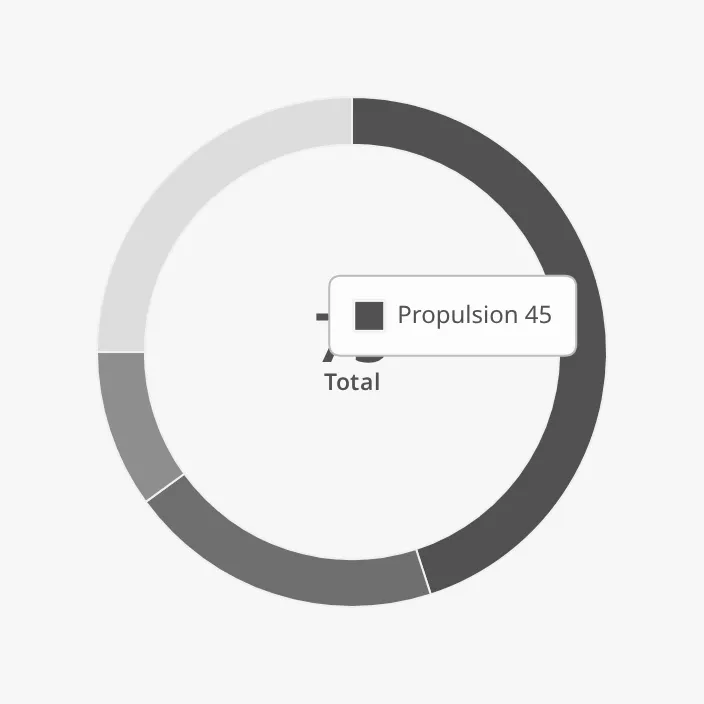
Properties
Section titled “Properties”| Name | Description | Property Type |
|---|---|---|
| data | The segments: a list of objects with label and value. Empty by default. |
array |
| max | The value of a full ring. Default 100. See Max. |
value |
max is the value of the whole ring. The part of max that the segments do not
fill is drawn as a light remaining sector, so the chart shows how much of a
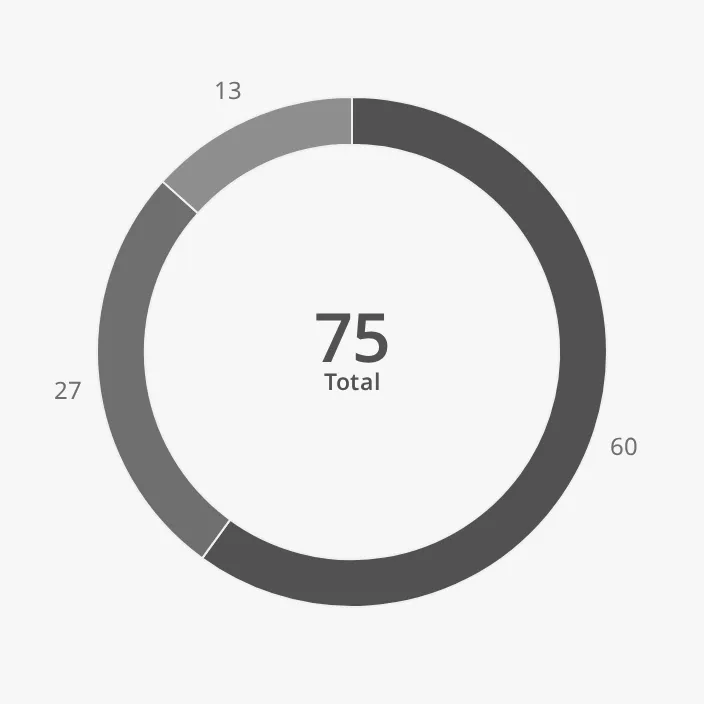
capacity is in use. With max set to 0, there is no remaining sector: the
segments fill the whole ring, each in proportion to the total. When the values
add up to more than max, there is no remaining sector either.
max also sets what a percentage is in the outer labels and the
legend: with outerLabelUnit set to %, a label shows the value as a percentage
of max (or of the total, when max is 0).
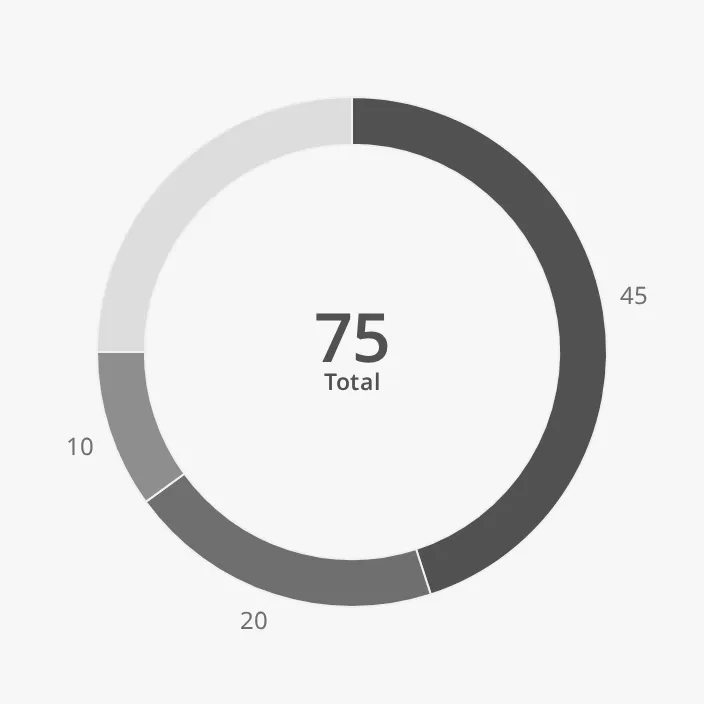
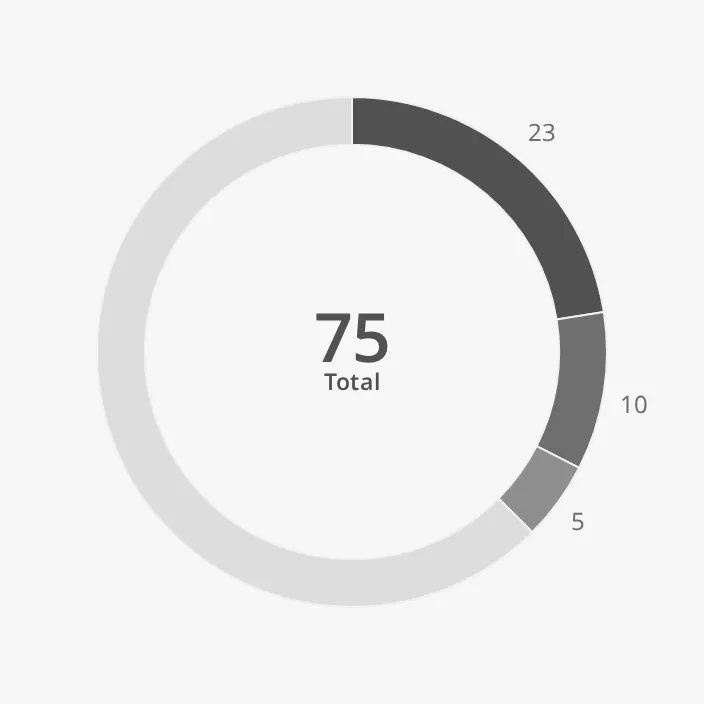
The same data (45, 20, 10) with three values of max, with outer labels
on:
| max | |
|---|---|
100 (default) |
 |
200 |
 |
0 |
 |
Layout
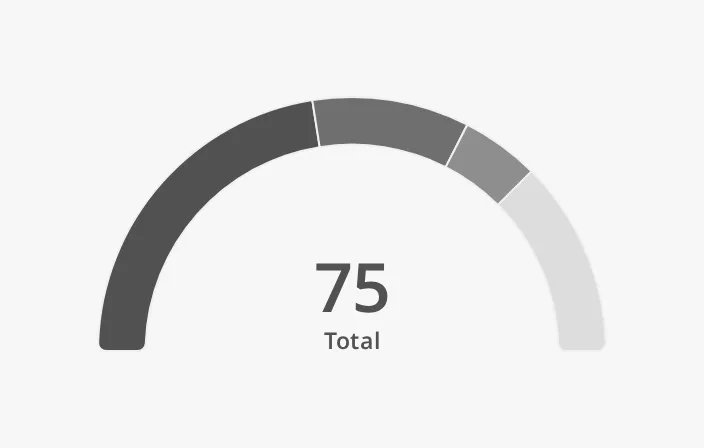
Section titled “Layout”half draws the chart as a half ring (180°) instead of a full ring. The
segments start at the left and the ends of the arc are rounded. A half donut at
the default fixedHeight is 320 × 192 px.
| half | |
|---|---|
false (default) |
|
true |
 |
thickness is the width of the ring, in px at the default fixedHeight:
| thickness | |
|---|---|
12 |
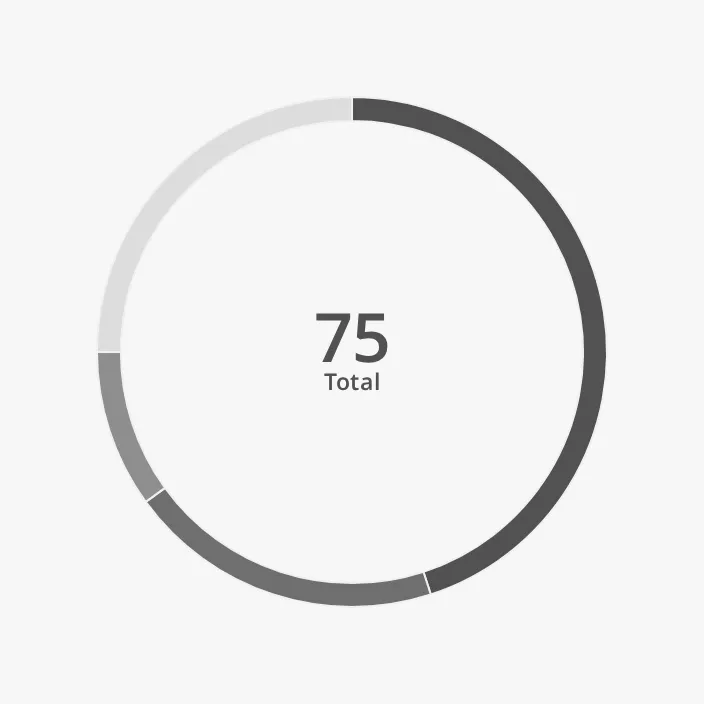 |
24 (default) |
|
48 |
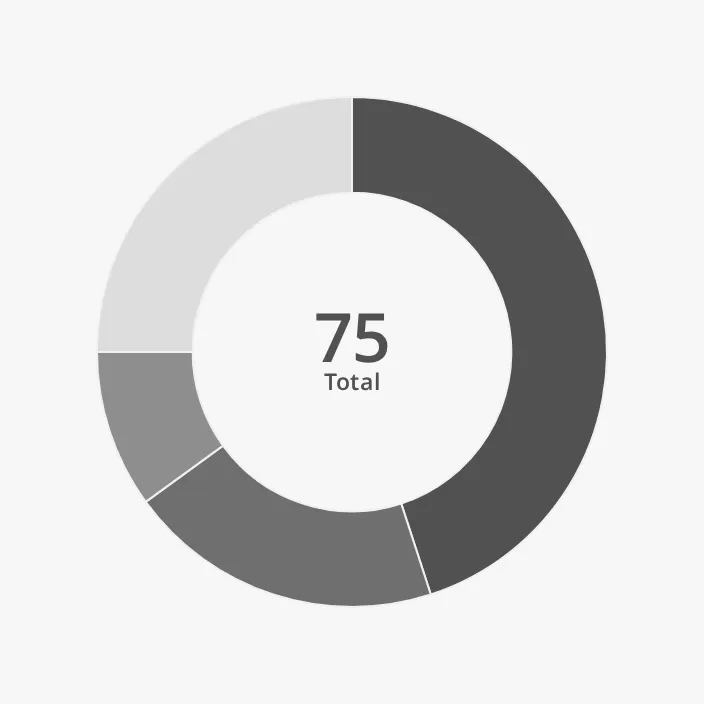 |
Properties
Section titled “Properties”| Name | Description | Property Type |
|---|---|---|
| half | Draw a half ring instead of a full ring. Default false. |
value |
| thickness | Width of the ring in px. Default 24. |
value |
Colours
Section titled “Colours”The segments are coloured in shades of the OpenBridge palette, from dark to
light. priority selects the shades:
| priority | |
|---|---|
regular (default) |
|
enhanced |
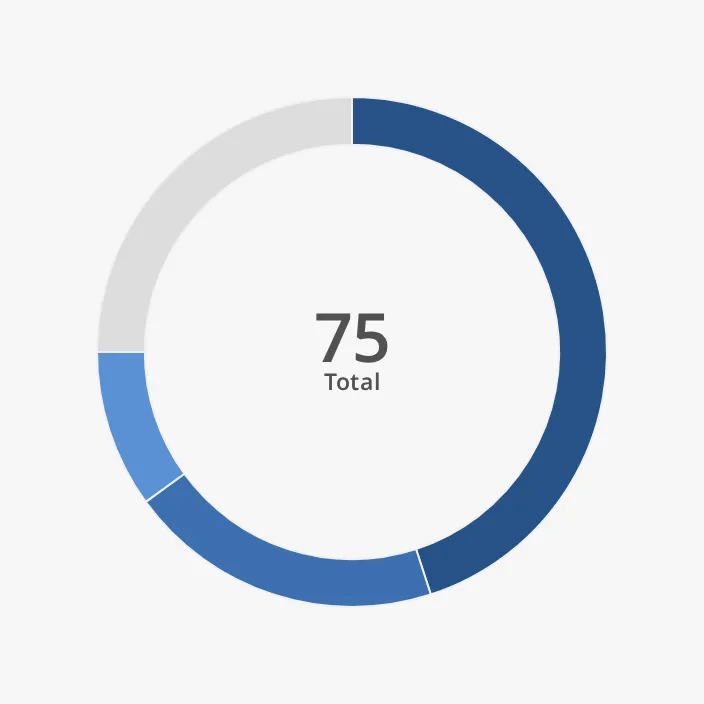 |
There are five shades; a sixth segment gets the first shade again.
colors replaces the shades with your own colours, one per segment, in the
order of data, for example ["#2f6fb5", "#e0a526", "#4c9a5a"]:
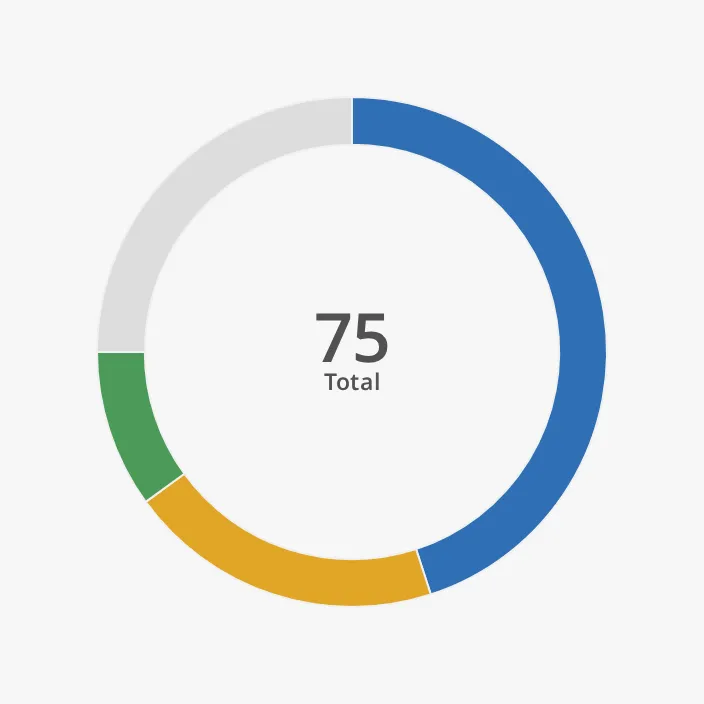
Note: A colour in
colorsmust be a plain colour value (#2f6fb5,rgb(47, 111, 181),steelblue). OpenBridge colour variables such asvar(--base-blue-500)are not understood and the segment is drawn black. Custom colours also stay the same in every palette, so leavecolorsempty where the chart must follow the day and night palettes. An entry that is not a colour value is drawn transparent.
The default shades follow the OpenBridge palette of the session:
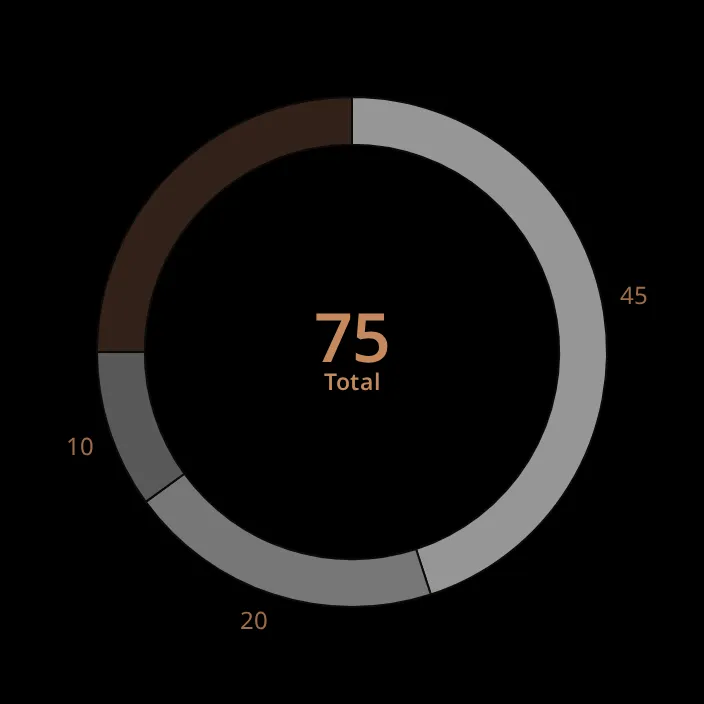
Properties
Section titled “Properties”| Name | Description | Property Type |
|---|---|---|
| priority | regular (grey shades) or enhanced (blue shades). Default regular. |
value |
| colors | Own colours for the segments, in the order of data. Empty by default (the palette). |
array |
Centre Readout
Section titled “Centre Readout”The centre shows the sum of all values, rounded to a whole number, with a
label and a unit below it. The total is the sum of the values as given, not a
percentage, so centerReadoutUnit is empty by default; set it to the unit of
the data. With centerReadoutLabel set to Load:
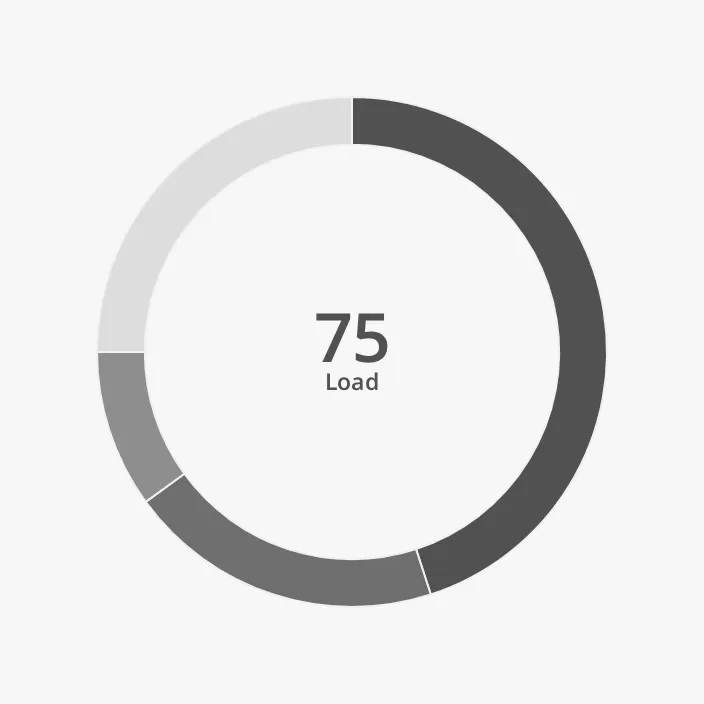
The centre readout cannot be turned off. It is hidden, together with the outer
labels, when fixedHeight is below 192 (see Size).
Properties
Section titled “Properties”| Name | Description | Property Type |
|---|---|---|
| centerReadoutLabel | Text below the total. Default Total. |
value |
| centerReadoutUnit | Unit after the label. Empty by default. | value |
Outer Labels
Section titled “Outer Labels”showOuterLabels writes the value of each segment beside the ring. The labels
show numbers only, not the segment names: the names are in the
legend and the tooltip.
| Properties | |
|---|---|
showOuterLabels = false (default) |
|
showOuterLabels = true |
|
and showUnit = true |
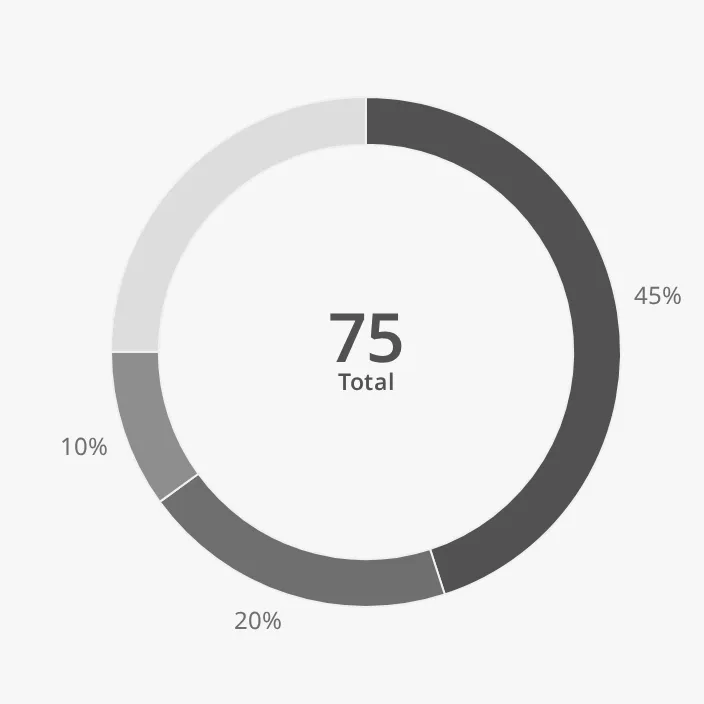 |
and outerLabelDecimalPlaces = 2 |
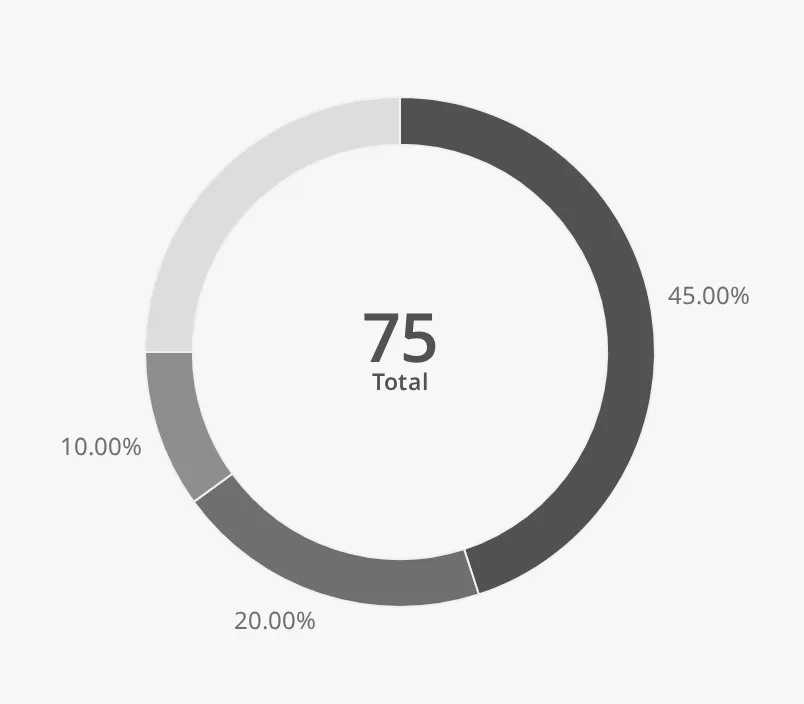 |
and outerLabelMaxLength = 4 |
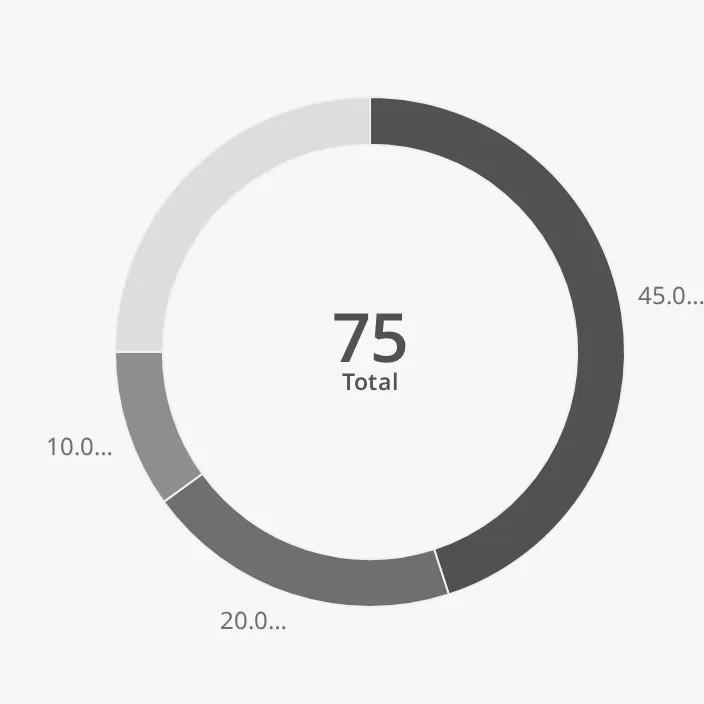 |
What a label shows depends on outerLabelUnit:
%(the default): the value as a percentage ofmax(of the total whenmaxis0). Withmax=200, the value45is shown as23.- any other unit, such as
kW: the value itself.
showUnit adds the unit to each label. outerLabelDecimalPlaces sets the
number of decimals. outerLabelMaxLength cuts a label (value and unit) that is
longer than that many characters and ends it with …; 0 is no limit.
Power in kW, with max = 2500, outerLabelUnit = kW, showUnit = true,
one decimal, and the centre readout set to Power / kW:
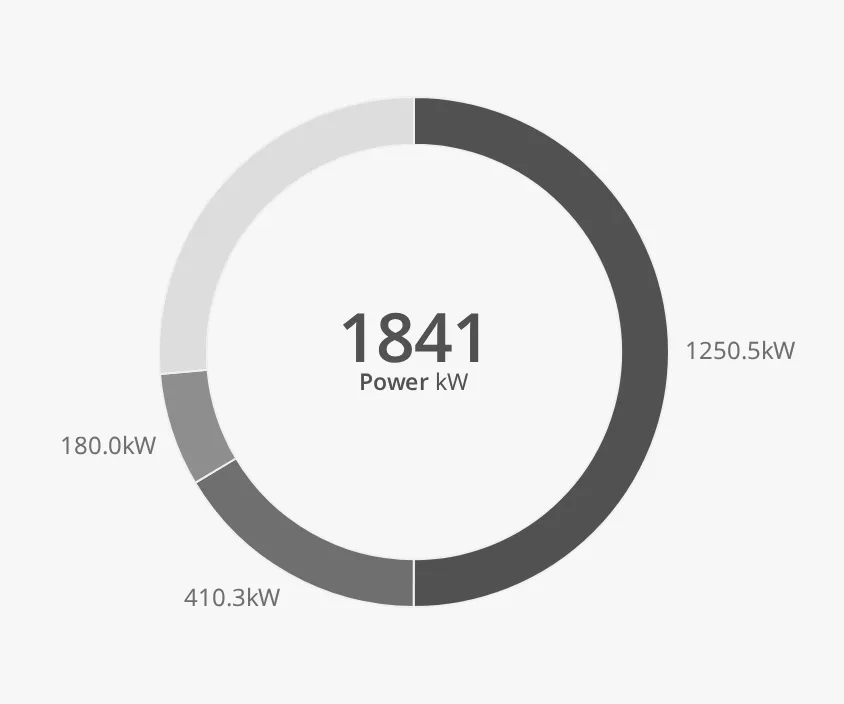
Long labels make the chart wider than fixedHeight: this one is 384 px wide.
Make the box wide enough for them.
Properties
Section titled “Properties”| Name | Description | Property Type |
|---|---|---|
| showOuterLabels | Write the value of each segment beside the ring. Default false. |
value |
| showUnit | Add outerLabelUnit to the outer labels and the legend values. Default false. |
value |
| outerLabelUnit | Unit of the labels. % shows percentages of max; any other unit shows the value. Default %. |
value |
| outerLabelDecimalPlaces | Number of decimals in the labels. Default 0. |
value |
| outerLabelMaxLength | Cut labels longer than this many characters. 0 is no limit. Default 0. |
value |
Legend
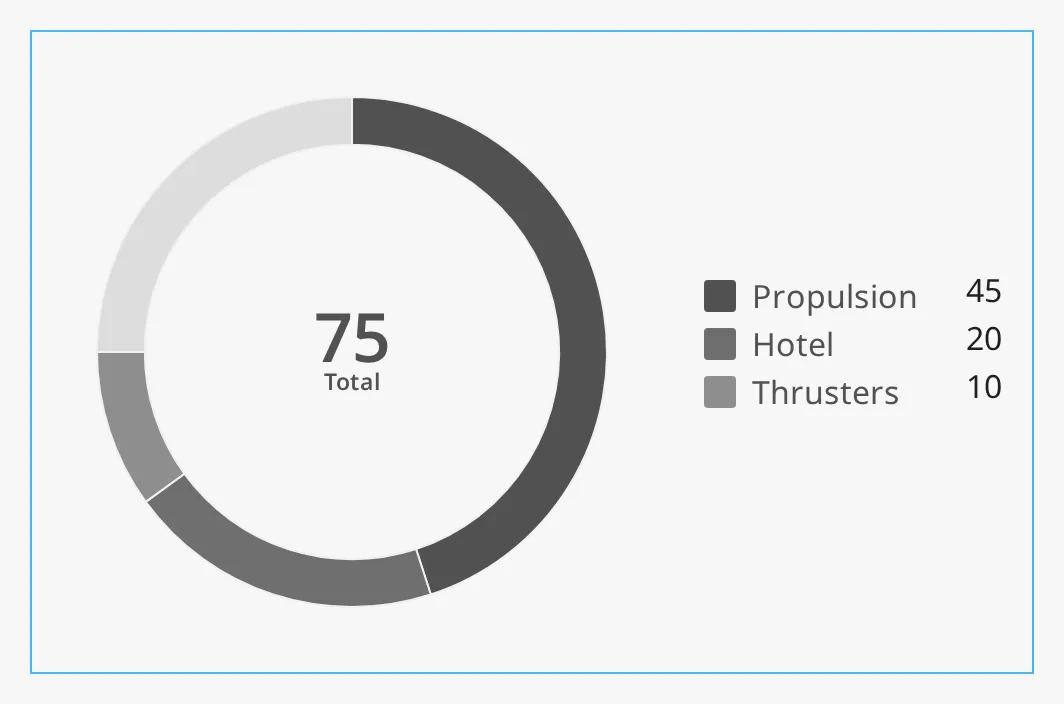
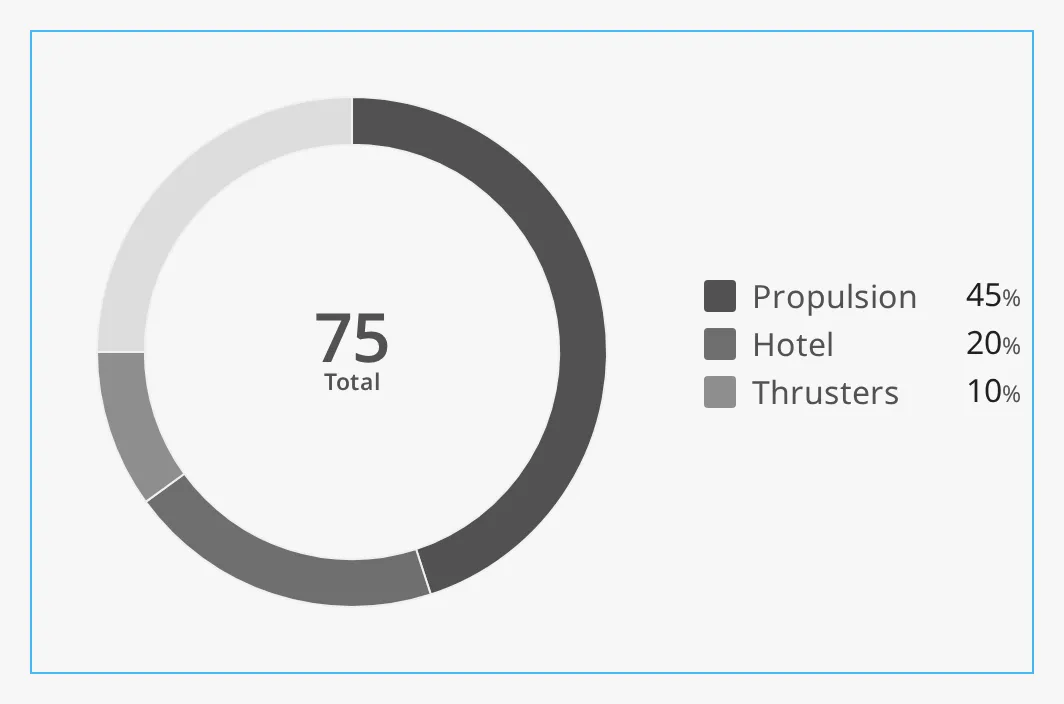
Section titled “Legend”legend adds a list of the segments, with their colour, label and value. The
values are formatted like the outer labels. The legend is
drawn to the right of the chart, and makes the chart about 160 px wider
than fixedHeight. The blue frame is a box of 500 × 320:
legend = true:
and showUnit = true:
Note: Make the component’s box wide enough for the legend. In a box of the default 320 × 320 the legend is drawn outside the box.
Properties
Section titled “Properties”| Name | Description | Property Type |
|---|---|---|
| legend | Show a legend right of the chart. Default false. |
value |
The chart is drawn at a fixed height, fixedHeight, and is that wide too
(plus room for long outer labels and the legend). It stays at the top left of
the component’s box and does not follow the size of the box. The default
fixedHeight of 320 matches the size of the other OpenBridge round
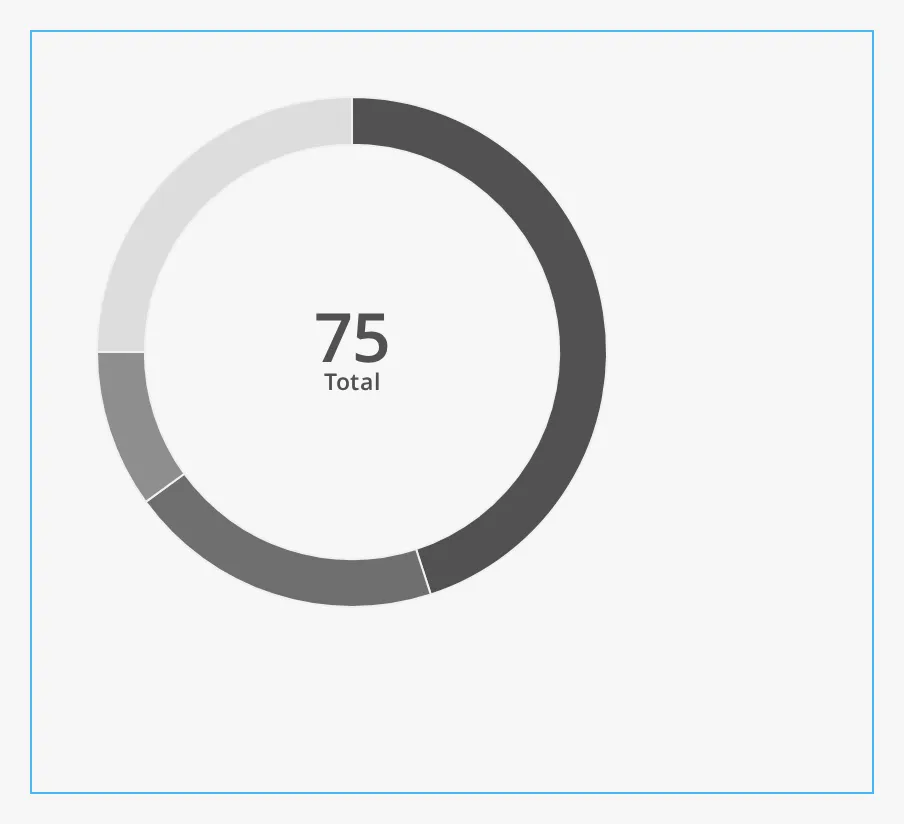
instruments. Give the box the same size as the chart. The blue frame is a box
of 420 × 380:
Below a fixedHeight of 192, the centre readout, the outer labels and the
tooltip are left out:
| fixedHeight | |
|---|---|
160 |
 |
240 |
 |
320 (default) |
|
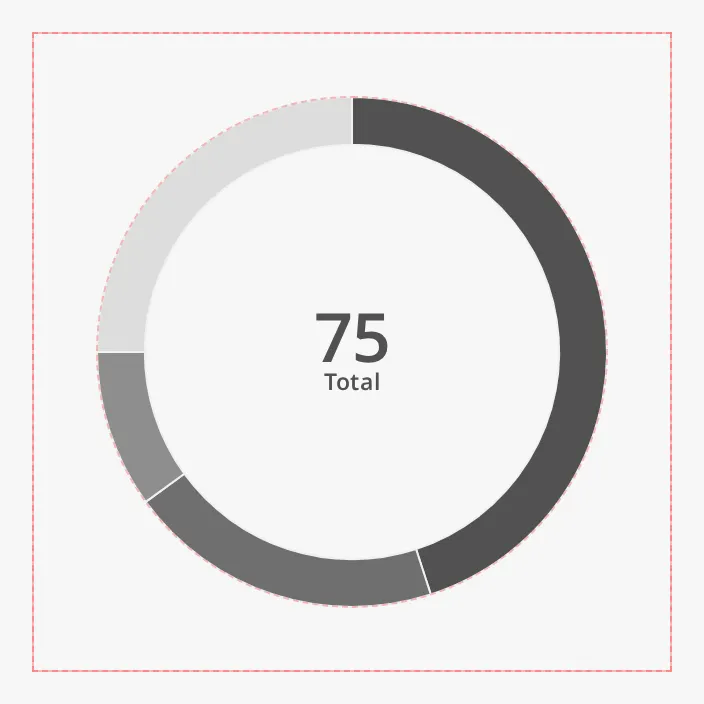
showDebugOverlay draws a red frame around the chart and a dashed circle around
the ring, for checking the layout. Leave it off in a project.
Properties
Section titled “Properties”| Name | Description | Property Type |
|---|---|---|
| fixedHeight | Height (and ring size) of the chart in px. Default 320. |
value |
| showDebugOverlay | Draw layout guides over the chart. Default false. |
value |
Component Events
Section titled “Component Events”The Donut Chart has no component events of its own.
Examples
Section titled “Examples”Example 1 — Power Use on MS Nordkapp
Section titled “Example 1 — Power Use on MS Nordkapp”-
Drop a Donut Chart into the view and make its box 500 × 320.
-
Set:
Property Value max 2500outerLabelUnit kWshowUnit trueshowOuterLabels truelegend truecenterReadoutLabel PowercenterReadoutUnit kW -
Set
datato:[{"label": "Propulsion", "value": 0},{"label": "Hotel", "value": 0},{"label": "Thrusters", "value": 0}] -
Bind
data[0].value,data[1].valueanddata[2].valueto the power tags, for example[default]Power/Propulsion,[default]Power/Hoteland[default]Power/Thrusters.
The ring then shows how much of the 2500 kW is in use, the centre the total power, and the legend the power of each consumer.
Example 2 — Tank Capacity as a Half Ring
Section titled “Example 2 — Tank Capacity as a Half Ring”- Drop a Donut Chart and make its box 320 × 192.
- Set
halftotrue,maxto100,centerReadoutLabeltoFilledand setcenterReadoutUnitto%. - Set
datato one segment,[{"label": "Fuel", "value": 0}], and binddata[0].valueto the fill level in percent, for example[default]Tanks/Fuel01/Level.
Found an error or something unclear?
Tell us what is wrong, confusing or missing on this page.
Built on the OpenBridge Design System