Connector Diagram
The Connector Diagram is a canvas for process and single-line diagrams. You place automation symbols on it — tanks, valves, pumps, switches — and draw pipes between them in the Designer. At runtime the diagram shows which pipes carry the medium, from the state of the symbols: open a valve and the pipes through it light up. It is found in the Chart - OpenBridge section of the Perspective Component Palette as Connector Diagram.
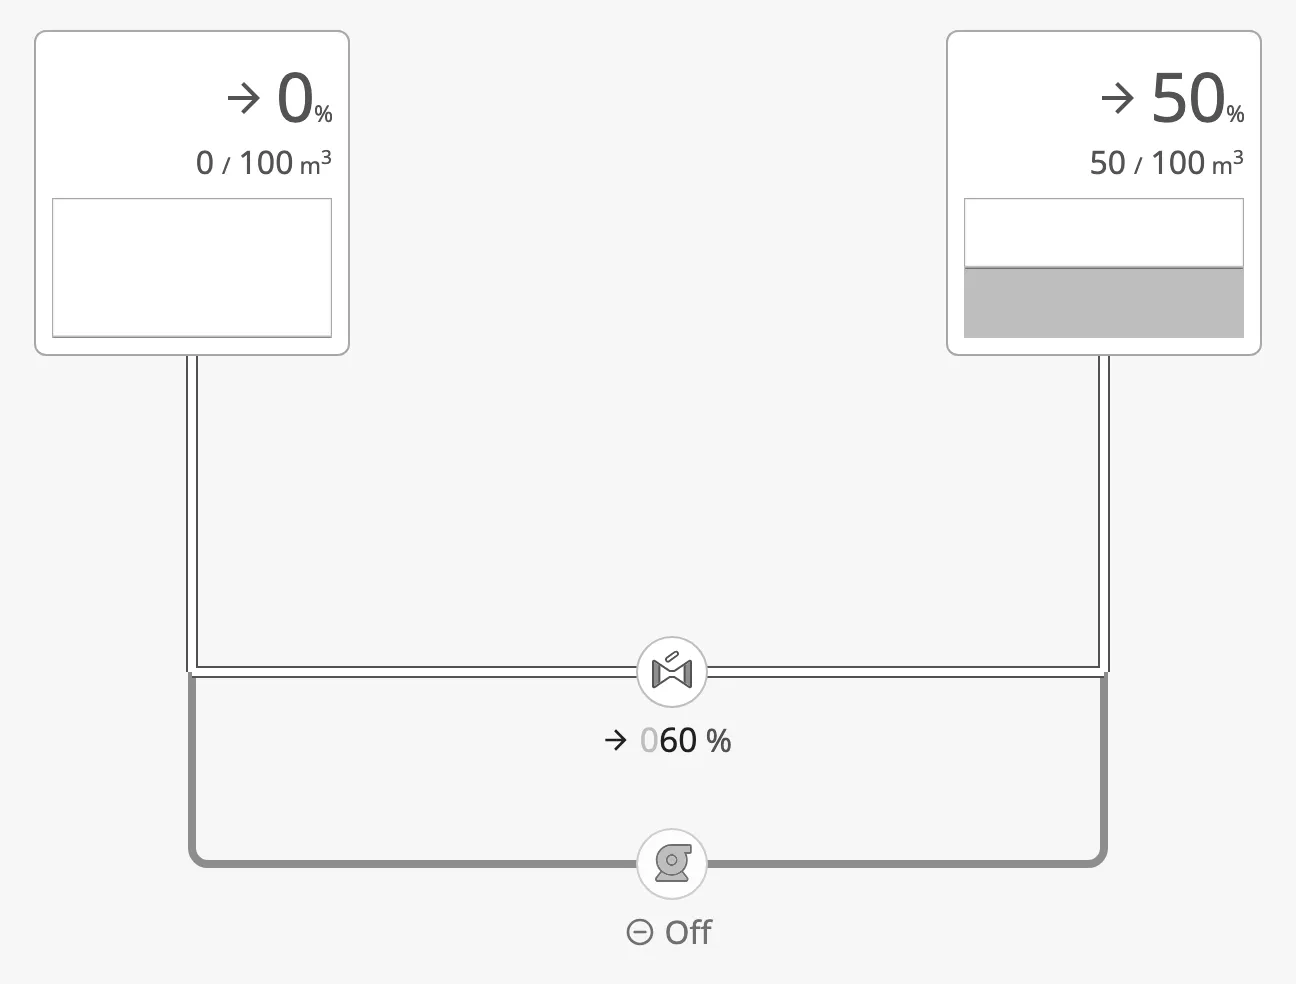
The parts of a diagram:
- Symbols — ordinary Perspective components placed inside the diagram. See Symbols.
- Pipes — the lines between them, drawn in the Designer. See Drawing Pipes.
- Flow — which pipes carry the medium, worked out from the symbols. See Flow.
- User toolbar — the bar at the bottom, where the operator switches the colours, tags and readouts. See User Toolbar.
“Pipe” is used for every kind of line: a pipe, a cable, a duct. What it carries is its medium (water, fuel, power, …).
Creating a Connector Diagram
Section titled “Creating a Connector Diagram”A diagram usually fills a whole view, so the quickest start is a new view with the Connector Diagram as its root container:
-
Open the Designer and the project.
-
In the Project Browser, expand Perspective, right-click Views and choose New View….
-
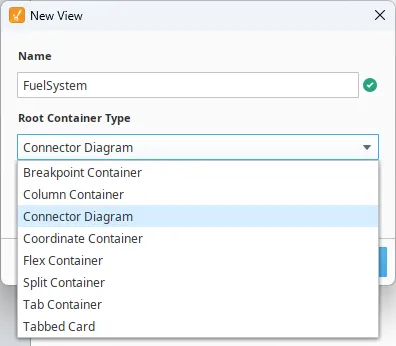
Give the view a name, and choose Connector Diagram under Root Container Type:
-
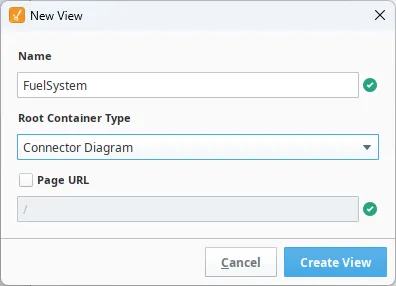
Tick Page URL if the view should also be a page of the project, and press Create View:
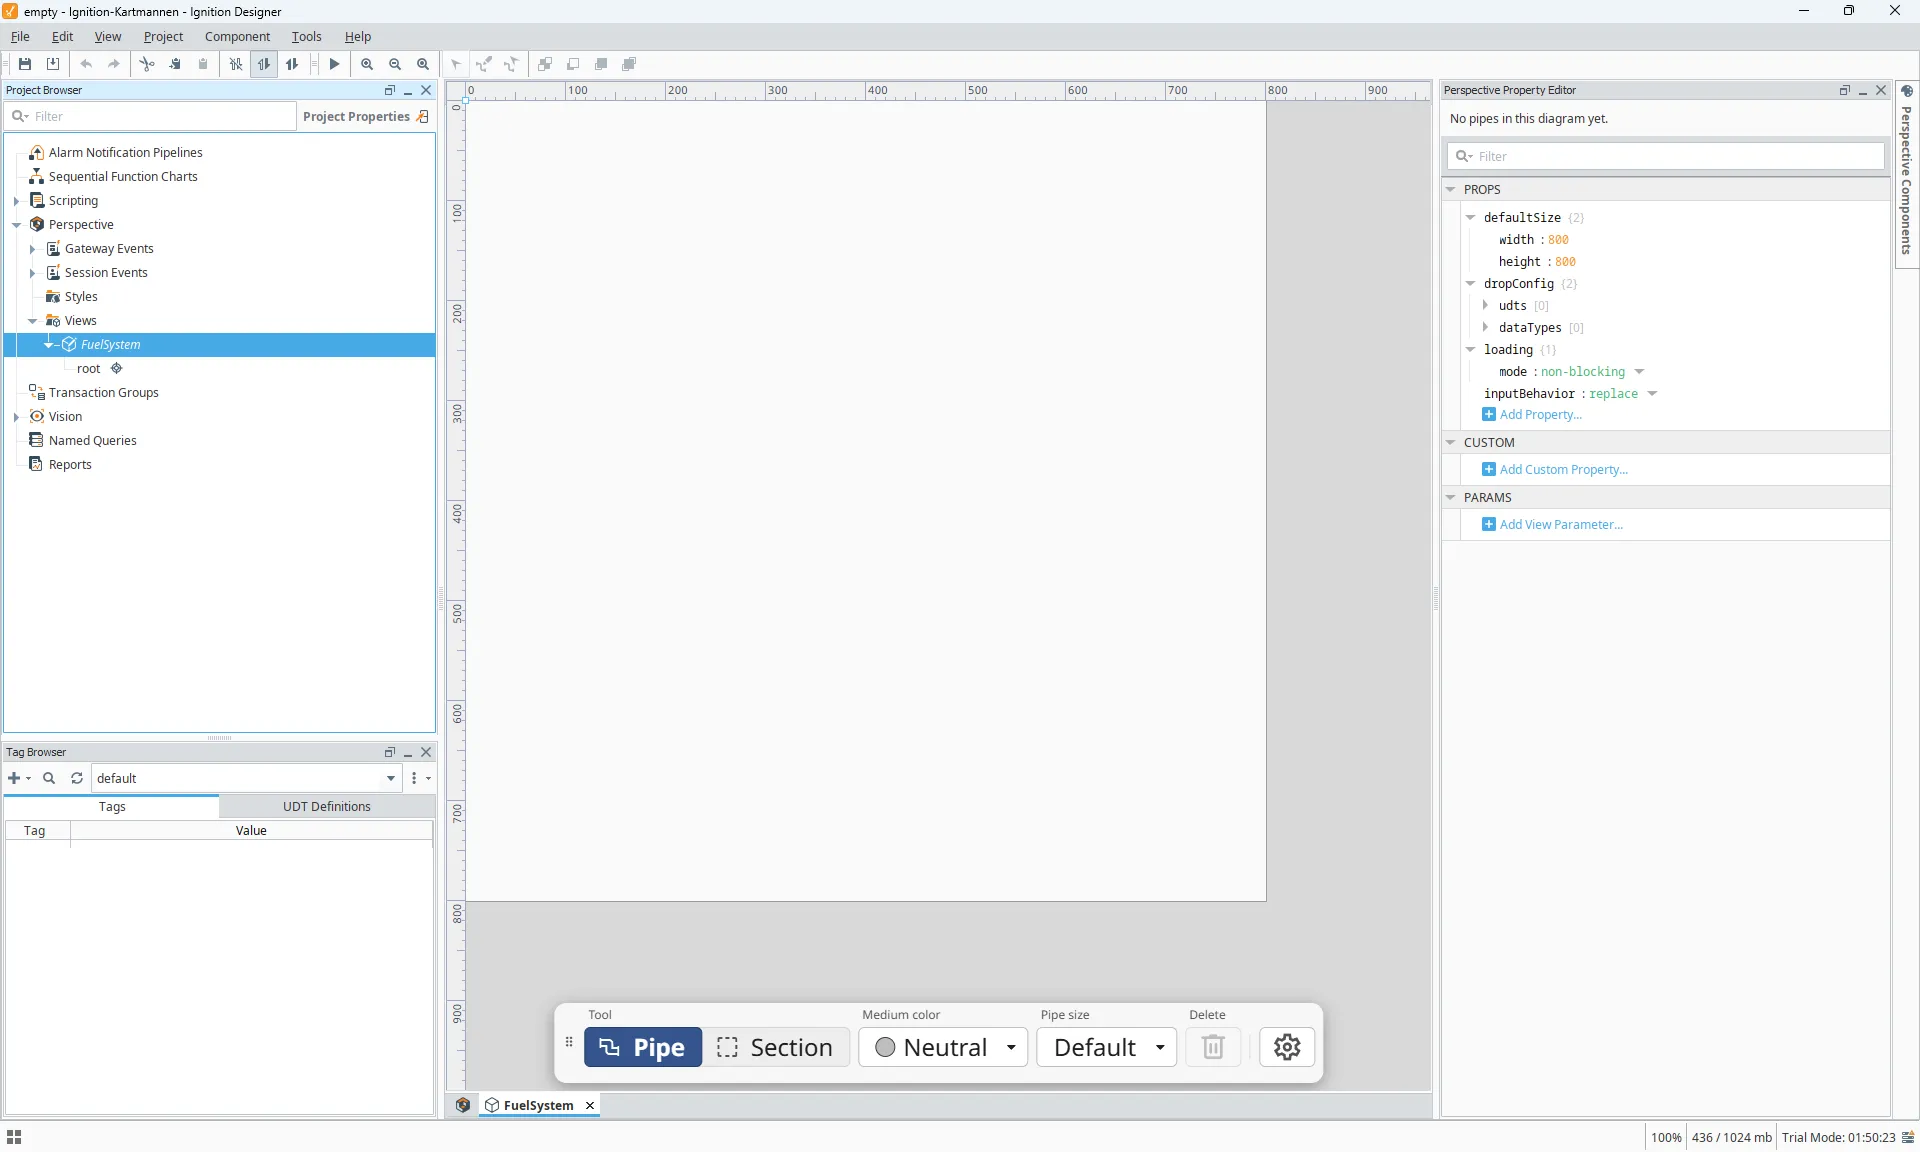
The view opens with an empty diagram. The editing toolbar sits at the bottom of the canvas, and the Property Editor shows the pipe panel above the diagram’s properties — “No pipes in this diagram yet” until you draw one:
Next, drop symbols onto the diagram from the Perspective Component Palette and draw pipes between them.
Note: The Designer remembers the root container type you chose last; the next New View starts with Connector Diagram already selected.
To put a diagram into an existing view instead, drag Connector Diagram from the Chart - OpenBridge section of the palette, like any other component.
Symbols
Section titled “Symbols”The Connector Diagram is a container. Drop symbols onto it in the Designer,
and move and size them as in a coordinate container: each has x, y,
width and height under position.
Any component can sit in the diagram, but pipes connect to the automation symbols — Pump, Valve, Switch, Automation Tank and the rest — and only some of them take part in the flow.
The name of a symbol matters: a pipe stores the names of the symbols at its
ends. Give symbols meaningful names (FuelPump1, TankFW) before drawing
pipes; the pipe list in the Designer then reads like the process.
A new diagram is 600 × 400 px. Make it the root of its view, or give it the size of the area the process fills.
Drawing Pipes
Section titled “Drawing Pipes”Pipes are drawn in the Designer, on the diagram itself. At runtime the diagram is display-only: the operator cannot move or draw pipes.
Connection Points
Section titled “Connection Points”Hover over a symbol to see its connection points, one in the middle of each side (large symbols have more). The one nearest the pointer shows a +:
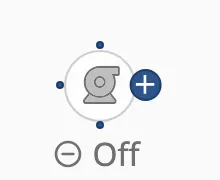
- Draw a pipe: press on the + and drag to a connection point of another symbol. Release on an existing pipe to join it with a T; release in empty space to leave a loose end.
- Move a symbol: press in the middle of the symbol. Pressing the body moves the symbol; pressing the edge draws a pipe.
The diagram routes the pipe with right-angled corners, and re-routes it when you move a symbol:
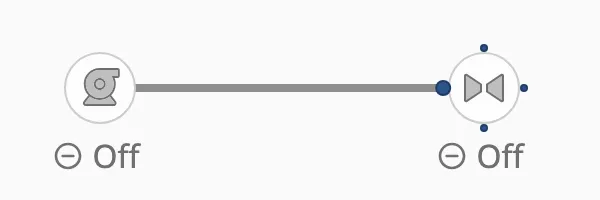
Several Connection Points on One Side
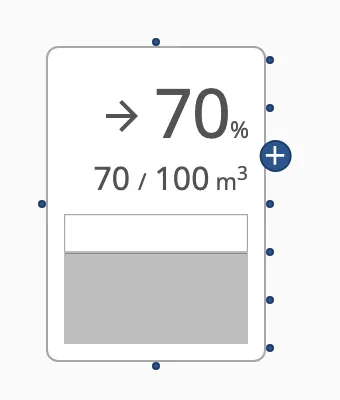
Section titled “Several Connection Points on One Side”A large symbol, such as a tank, has more than one connection point per side:
besides the middle one there is a point every gridSize px either way along
the side, as far as the side reaches. A 100 px high tank on a 24 px grid has
five on each side — the middle and two above and below it.
Move the pointer to the edge of a side to show all of that side’s points. The + marks the one nearest the pointer; the other sides keep showing only their middle point:
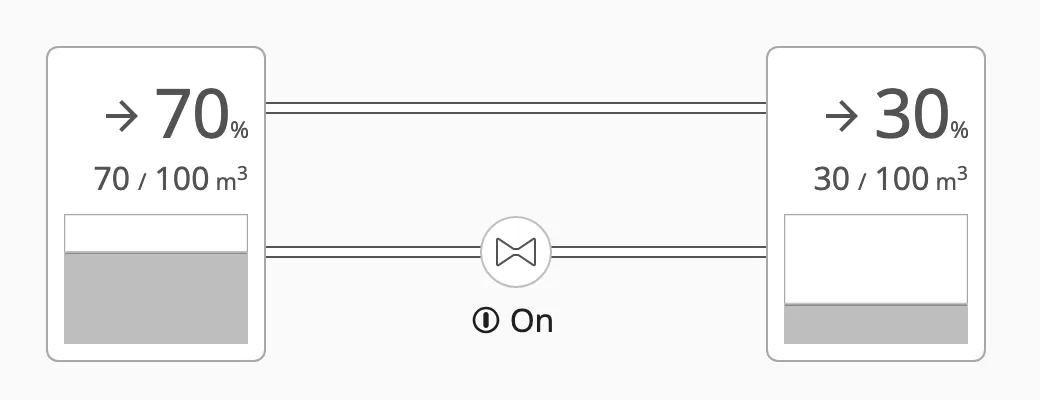
Each point takes its own pipe, so one side of a tank can feed several lines:
A point that already has a pipe keeps its larger marker whenever the symbol is hovered, so you can see which points on a side are taken:
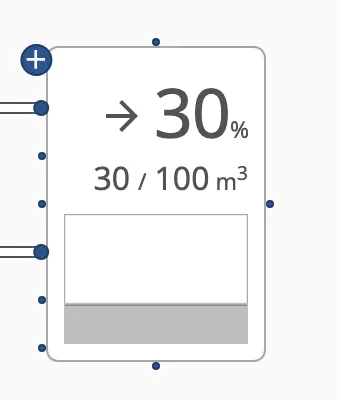
The points are a whole number of grid steps from the middle, so facing points
on two symbols of the same size, side by side, line up and the pipe between
them runs straight. In the pipe’s from/to, the point is stored as offset
— see Pipe Properties.
Changing a Pipe
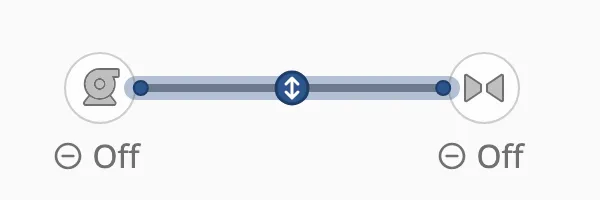
Section titled “Changing a Pipe”Click a pipe to select it. The round handles on each straight run slide that run sideways, to shape the route by hand; drag an end to connect it somewhere else. The Delete key, or the bin in the toolbar, deletes the selected pipe.
The Editing Toolbar
Section titled “The Editing Toolbar”While you edit, a toolbar sits at the bottom of the diagram:

| Control | What it does |
|---|---|
| Tool | Pipe draws and edits pipes; Section draws background sections. |
| Medium color | The medium of the selected pipe, from the diagram’s medium palette. |
| Pipe size | The thickness of the selected pipe. Default takes the size of its medium. |
| Endpoint | The end mark of the selected pipe end. Shown while a pipe end is selected — click an end of a selected pipe. |
| Delete | Deletes the selected pipe or section. |
| ⚙ | Opens the global settings: the medium palette. |

End Marks
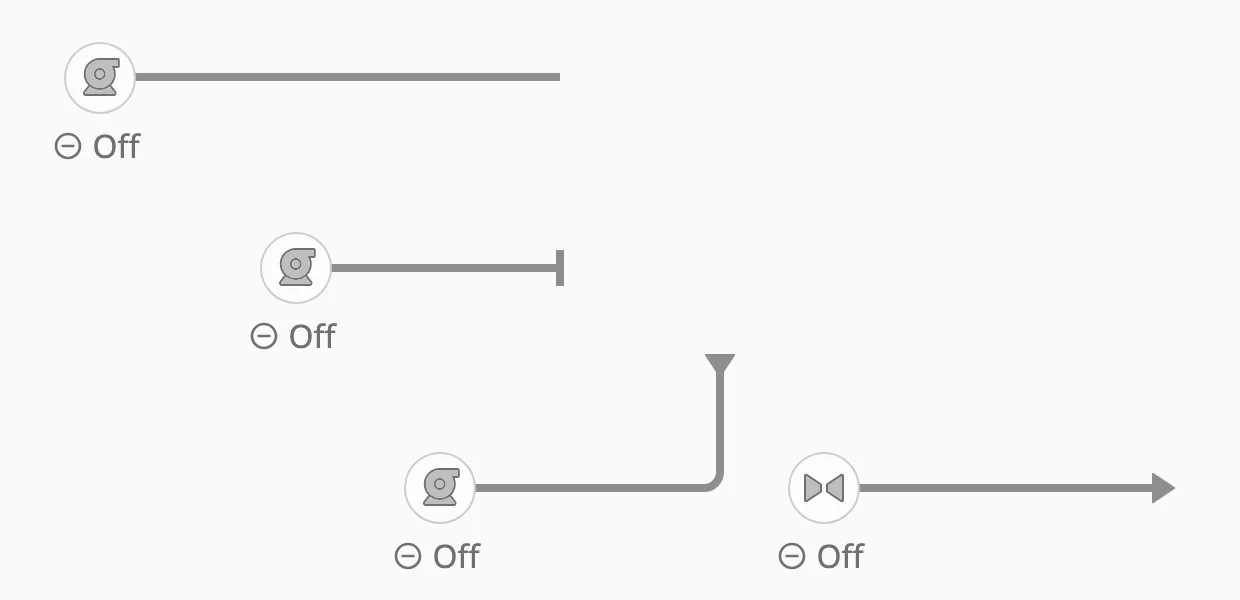
Section titled “End Marks”A pipe end that is not attached to a symbol can carry a mark. The marks also tell the flow where the medium comes from and where it goes:
| Endpoint (toolbar) | Value | Meaning |
|---|---|---|
| None | none |
A plain end. |
| Stop | cap |
The pipe ends here. The default for a loose end. |
| Coming from | arrow-in |
The medium arrives here from outside the diagram — a source for the flow. |
| Going to | arrow-out |
The medium leaves the diagram here — a sink for the flow. |
The diagram works out, every time something changes, which pipes the medium flows through. You do not bind the pipes to anything: bind the symbols to the process, and the pipes follow.
The Rule
Section titled “The Rule”A pipe carries the medium when it lies on a path from a source to a different sink. A pipe on no such path is drawn as an empty, grey line — “nothing flows here”, which the operator can tell apart from “no pipe here”.
-
Sources and sinks. A tank is both: the medium can leave it and arrive in it. A loose pipe end marked Coming from is a source, one marked Going to is a sink.
-
Gated symbols let the medium through only while they are open or running:
Symbol Lets the medium through while Valve, Analog Valve, Digital Valve openistruePump, Fan, Motor onistrueSwitch, Damper onistrue -
Three-way valves (Digital Threeway Valve, Analog Threeway Valve) let the medium through between their open ports only. Each port has its own gate:
open1,open2(the stem) andopen3—trueon the digital valve, above0% on the analog one. The ports turn withorientation: with the stem pointing down, port 1 is left, port 2 bottom and port 3 right. With fewer than two ports open nothing passes, and a pipe on the side without a port never carries flow. -
Everything else — a readout, a filter, a symbol without a state — lets the medium through freely, as a fitting would.
-
A pump is not a source. It moves what reaches it; with no tank or Coming from end behind it, the pipes around a running pump stay empty.
-
Junctions (T and cross) always let the medium through.
-
A closed pipe blocks. A pipe whose
stateisclosedblocks the flow, whatever the symbols do. -
Signal lines take no part. A pipe on a Signal medium never carries flow and does not connect the pipes it touches.
What each symbol means is built into the module and is the same in every diagram; you cannot change it per view.
Example
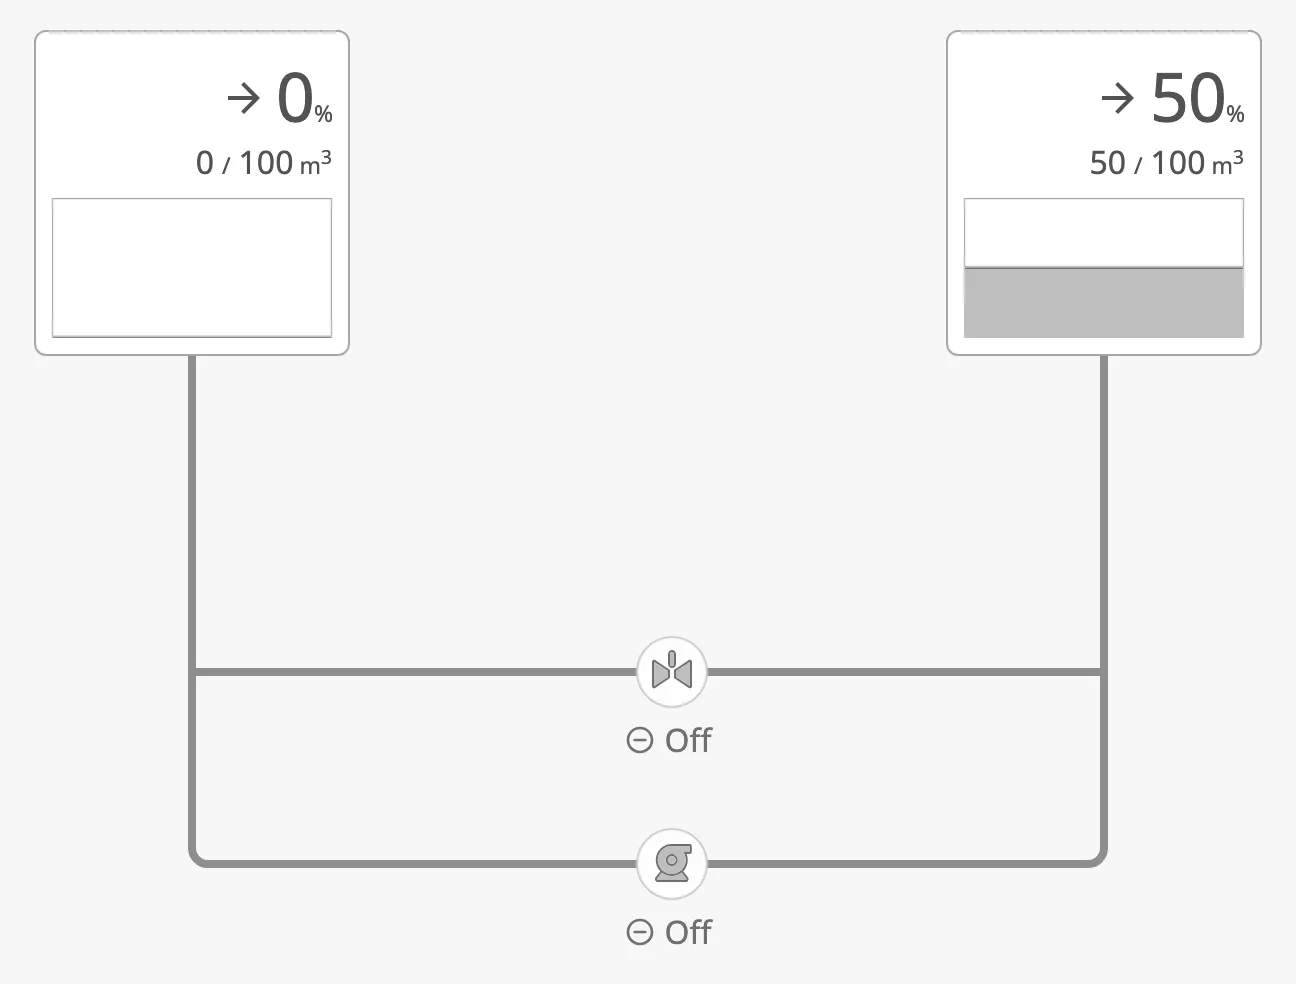
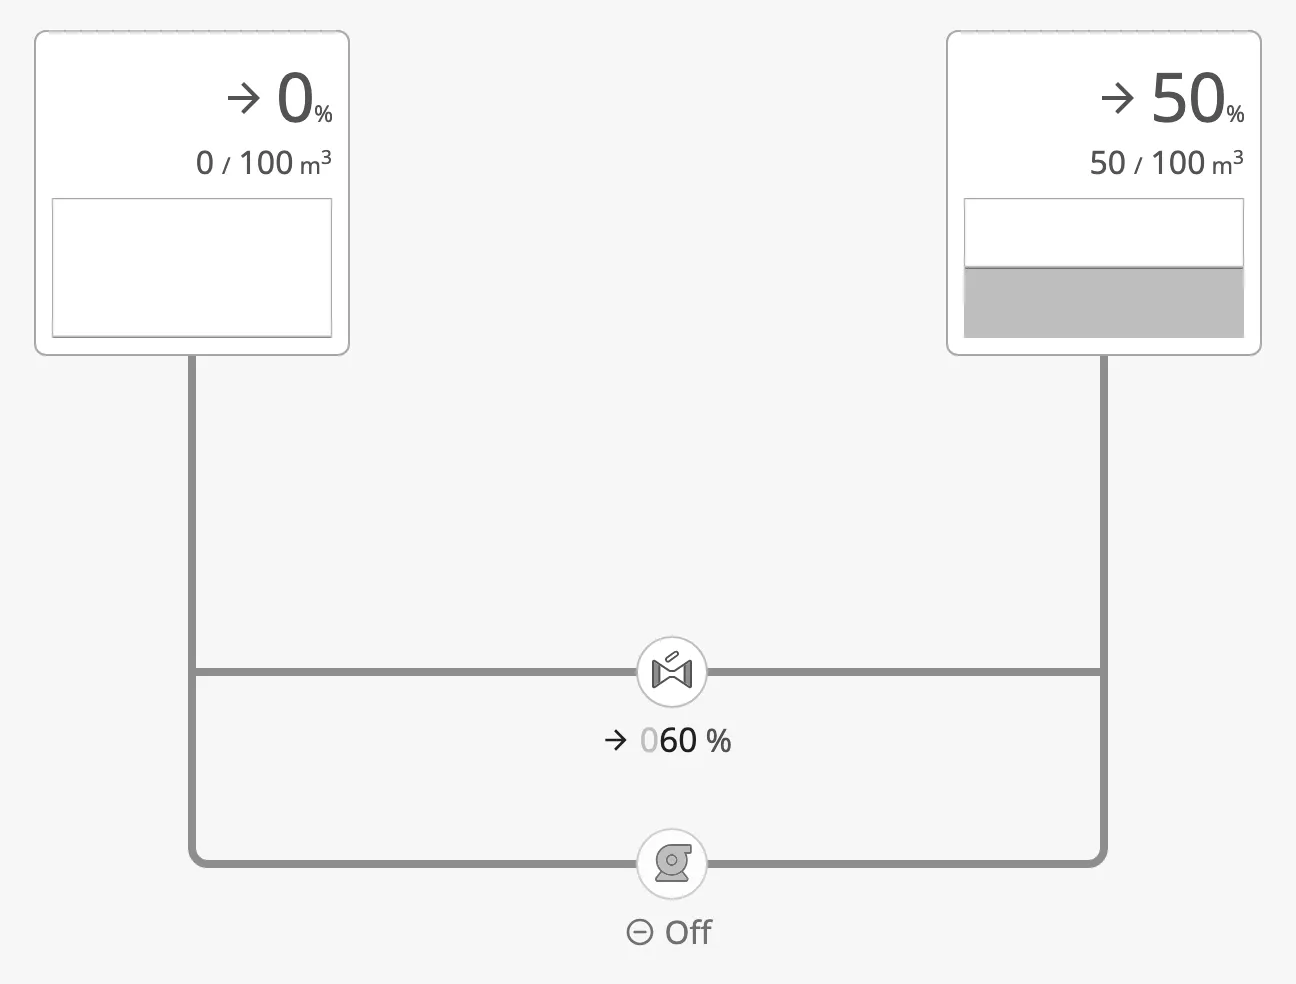
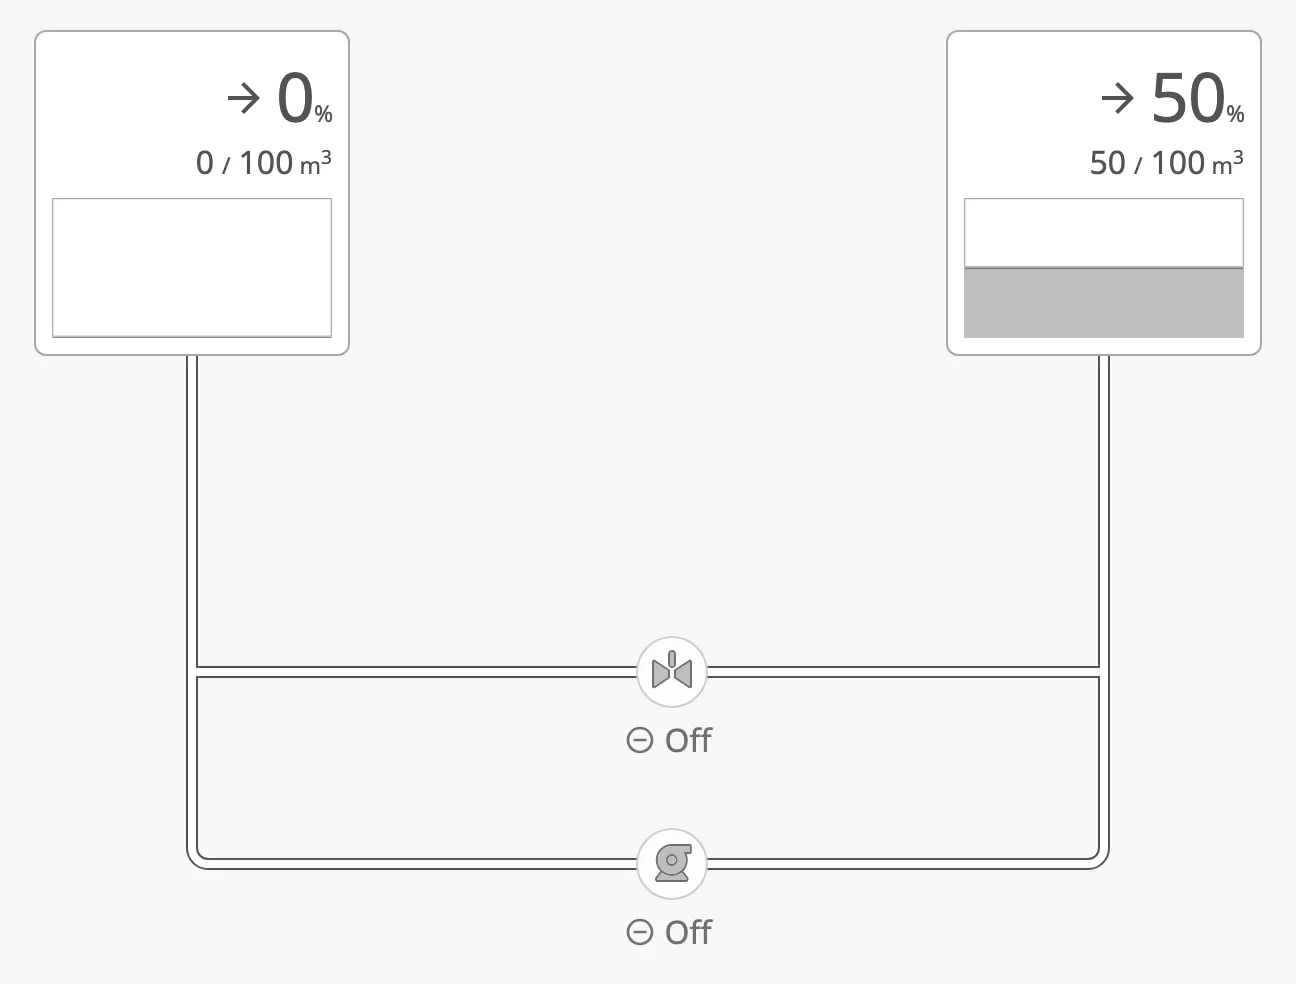
Section titled “Example”Two tanks are joined twice: through a valve, and through a pump. The tank on the left is empty, the one on the right half full — the flow does not depend on the level, only on the path.
Valve closed, pump off
Valve open
Pump on
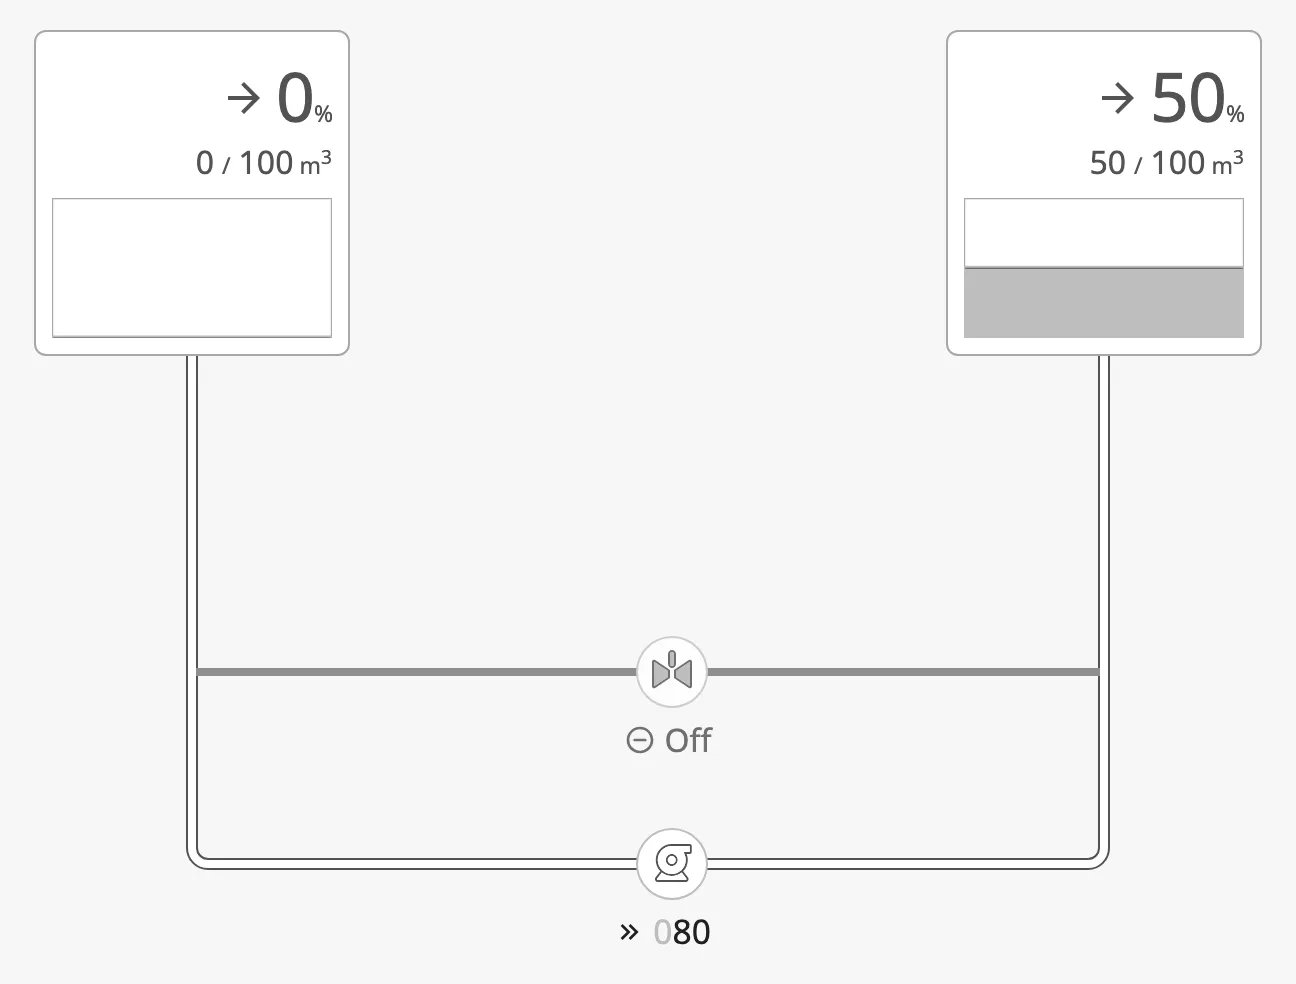
Valve open and pump on
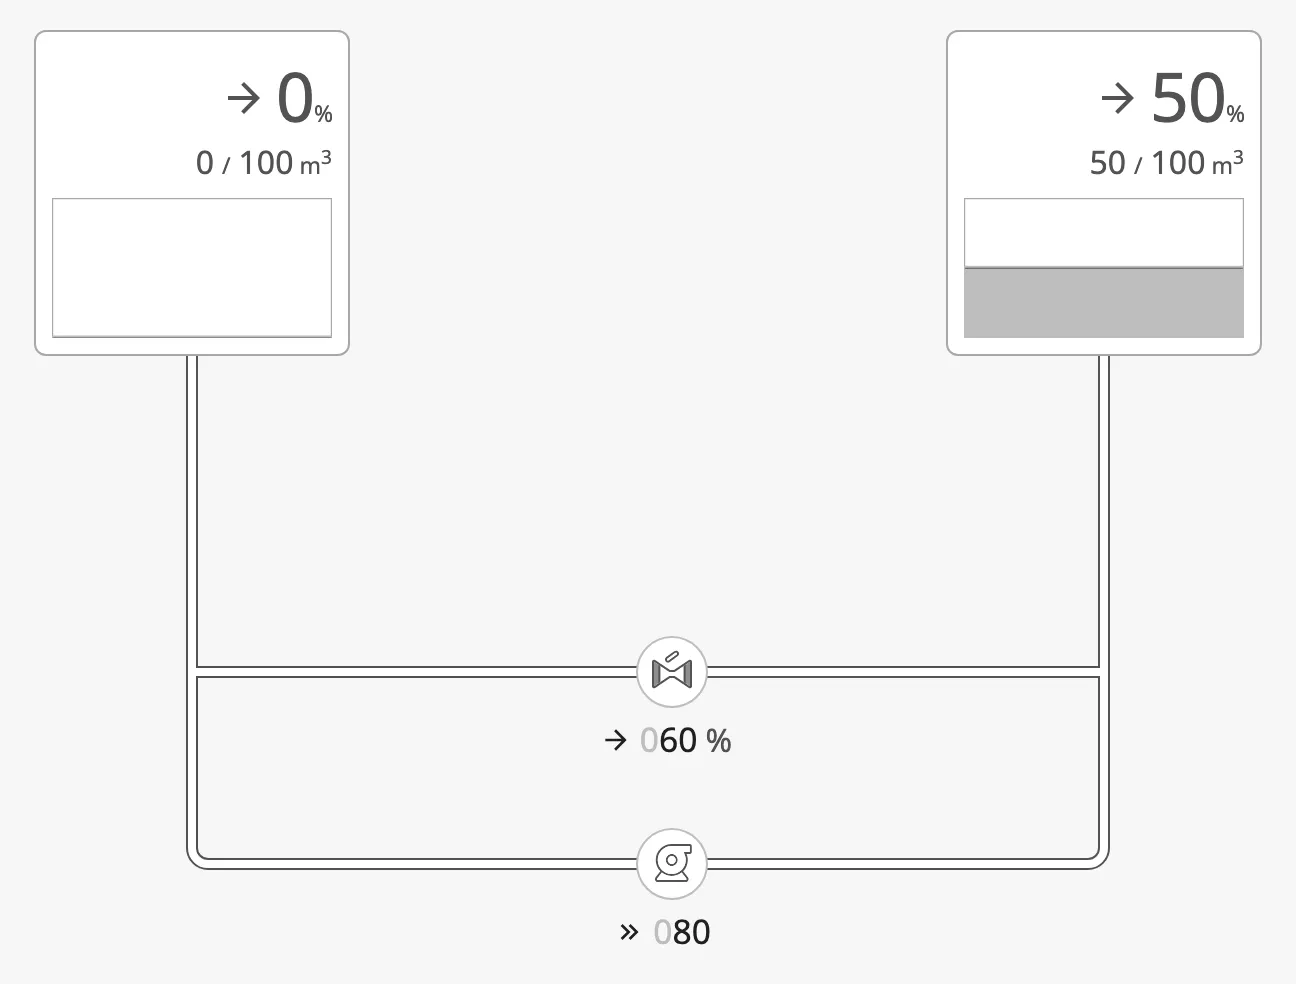
With the valve open but the pipe after it set to closed, there is no longer a
path from one tank to the other, and nothing flows — not even in the pipes
before the valve:
Manual Pipes
Section titled “Manual Pipes”A pipe can opt out of the automatic flow. Set its flow to manual, and it
shows its own state — bind that to a tag or an expression. The flow engine
still passes the medium through a manual pipe; only its look is yours.
| state | Looks like |
|---|---|
open |
The medium flows (coloured, or the flow style in regular mode). |
empty |
An empty pipe. |
closed |
A closed pipe. Also blocks the flow. |
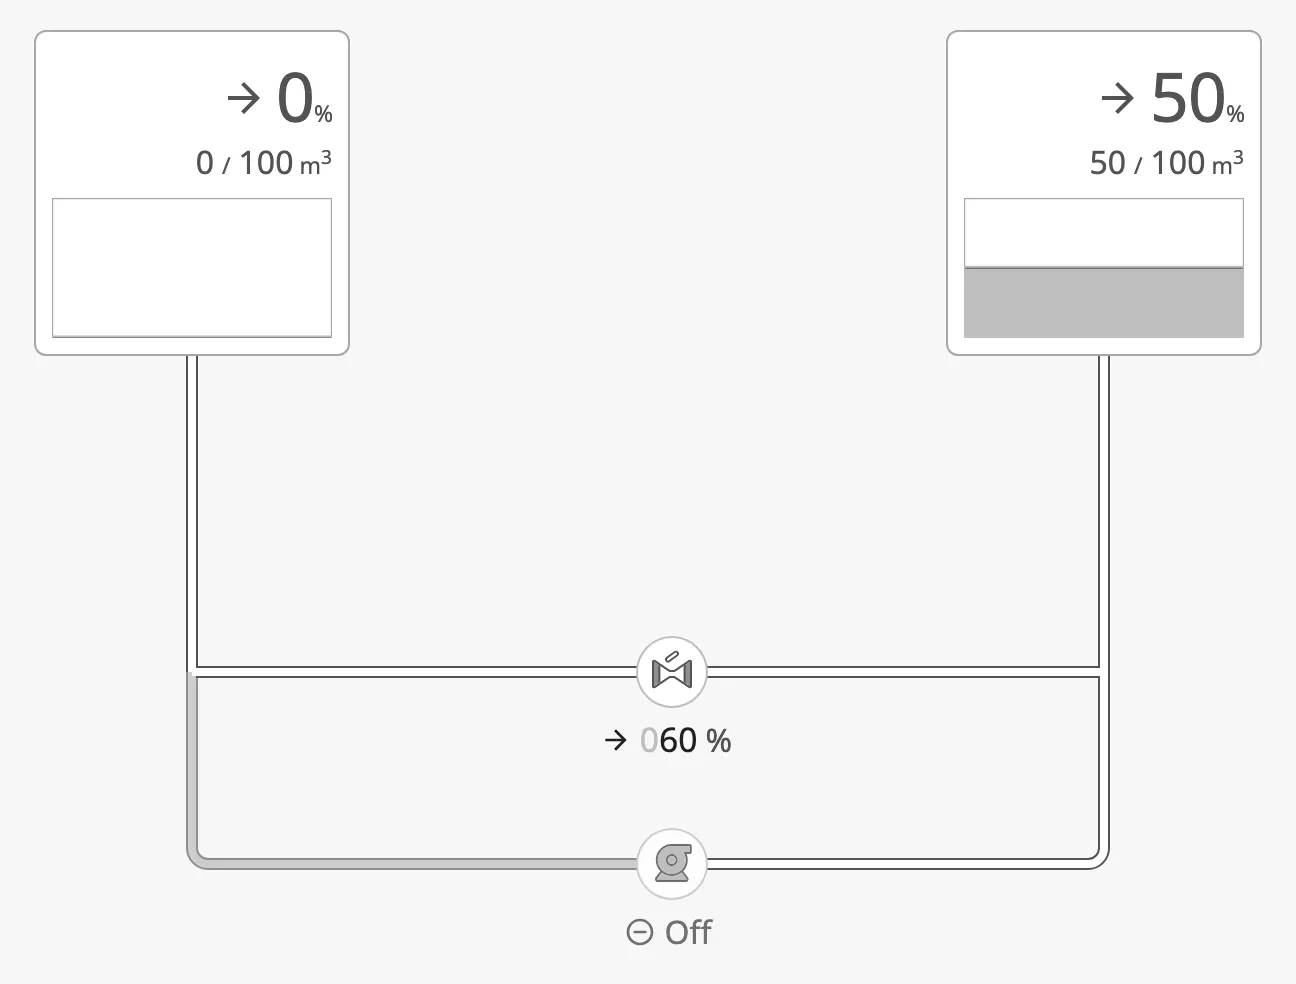
Below, the two pipes around the pump are manual: the one on the left is set to
empty, the one on the right to open, while the flow through the valve is
automatic:
Turning the Flow Off
Section titled “Turning the Flow Off”With flow.enabled set to false, no flow is worked out at all, and every
pipe shows its stored state (by default open) — as if every pipe were
manual:
Embedded Views
Section titled “Embedded Views”A symbol is often reused as a small view — a valve with its readout, bound to a tag path passed as a parameter — and embedded in the diagram. Such an embedded view takes part in the flow as the symbol it holds: an embedded view holding a valve lets the medium through while that valve is open.
An embedded view that holds a diagram of its own is joined to the outer diagram, so the flow continues through it.
Finding a Pipe and Changing Its Properties
Section titled “Finding a Pipe and Changing Its Properties”Every pipe has an id, a short generated name such as cmummicfa1. The
pipes are stored in the diagram’s connections property, keyed by that id:
props.connections.cmummicfa1.stateprops.connections.cmummicfa1.mediumIdprops.connections.cmummicfa1.directionThe id never changes, even when other pipes are added or deleted, so a binding
on props.connections.<id>.<property> stays on the right pipe.
In the Designer: the Pipe Panel
Section titled “In the Designer: the Pipe Panel”Select the Connector Diagram, or click a pipe on it. The Perspective Property Editor then shows a pipe panel at the top, above the diagram’s properties:
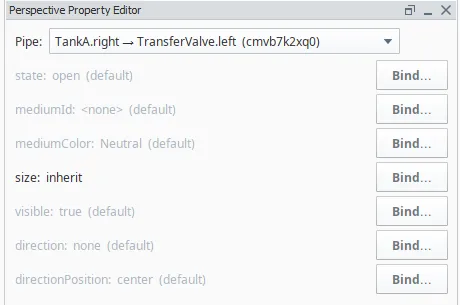
- Pipe — the selected pipe. Click a pipe on the canvas, or choose it
in this list. Each entry names the two ends (symbol name and side) and the
id, for example
TankA.right → TransferValve.left (cmvb7k2xq0)— this is how you see the id of a pipe. Until a pipe is chosen, the panel says “Pick a pipe above”; on a diagram without pipes, “No pipes in this diagram yet”. - Below the list, one row per bindable property of the pipe, with its current
value:
state,mediumId,mediumColor,size,visible,directionanddirectionPosition(see Pipe Properties). A grey value marked (default) is not stored on the pipe; a black one is. (bound) means the property already has a binding. - Click Bind… next to a property to open the Edit Binding dialog on
props.connections.<id>.<property>, or Edit binding… to change an existing one.
Choosing a pipe in the list also selects it on the canvas, so the list is also the way to find which pipe an id belongs to.
In the Property Editor Directly
Section titled “In the Property Editor Directly”Expand props → connections in the Property Editor. Each entry is one pipe,
named by its id; its from.componentId and to.componentId name the symbols at
its ends. Change or bind any property there as on any other component.
From a Script
Section titled “From a Script”The same path works in a script, for example to show a pipe as closed:
self.getSibling('ConnectorDiagram').props.connections['cmummicfa1'].state = 'closed'Pipe Properties
Section titled “Pipe Properties”| Name | Description | Property Type |
|---|---|---|
| state | open, empty or closed. Used as shown for a manual pipe; closed always blocks. Default open. |
value |
| flow | auto (the diagram decides) or manual (the pipe shows its state). Default auto. |
value |
| mediumId | The medium the pipe carries: an id from the medium palette. Empty by default. | value |
| mediumColor | A colour for the pipe directly, instead of a medium: Neutral, Enhanced, Blue, Cyan, Teal, Green, Yellow, Orange, Red, Purple, Indigo, or Dashed for a signal line. Wins over mediumId when set. See the note below. |
value |
| size | small, medium, large, xl, or inherit to take the size of the medium. Default inherit. |
value |
| visible | Show the pipe. Default true. |
value |
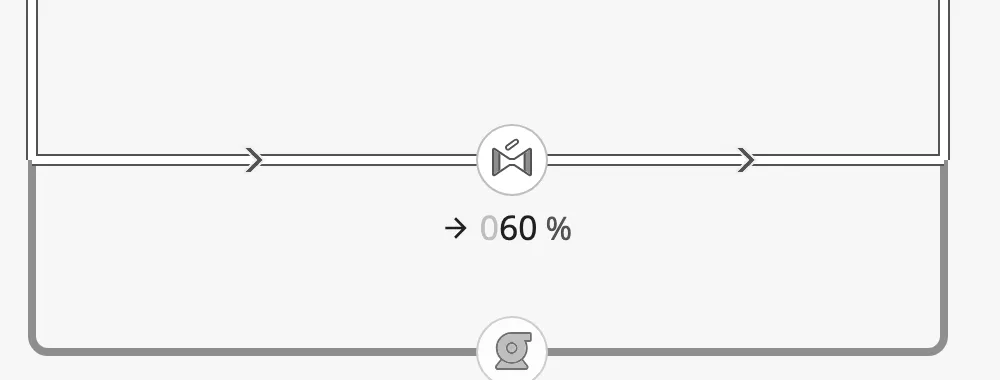
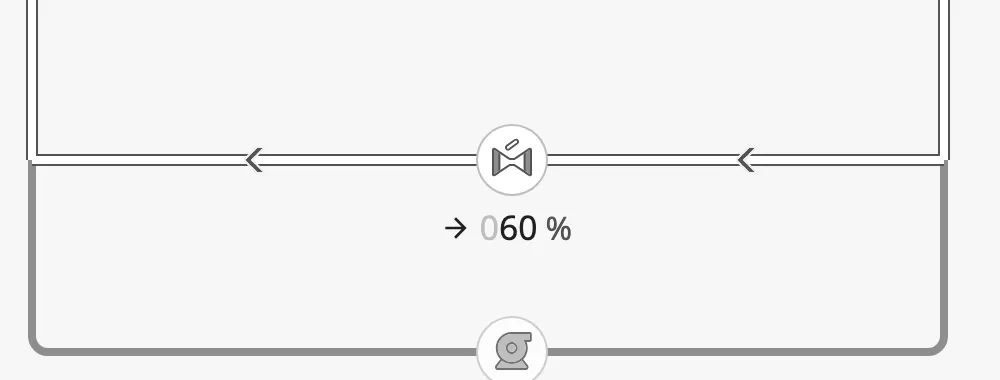
| direction | A flow-direction arrow on the pipe: none, forward (from → to) or reverse. Default none. |
value |
| directionPosition | Where the arrow sits: start, center or end. Default center. |
value |
| from, to | The two ends: the symbol (componentId) and side (direction), a junction, or a loose end with its x, y and end mark (terminal). An end on one of a large symbol’s extra connection points also has offset: px from the middle of the side (positive = down / right). Maintained by the editor. |
object |
Note: A pipe with both
mediumIdandmediumColorset showsmediumColor. Choosing a medium in the toolbar clearsmediumColor, which is what hands the colour to the medium. If a binding onmediumIdseems to do nothing, check whether the pipe has amediumColor.
direction = forward |
 |
direction = reverse |
 |
size = small |
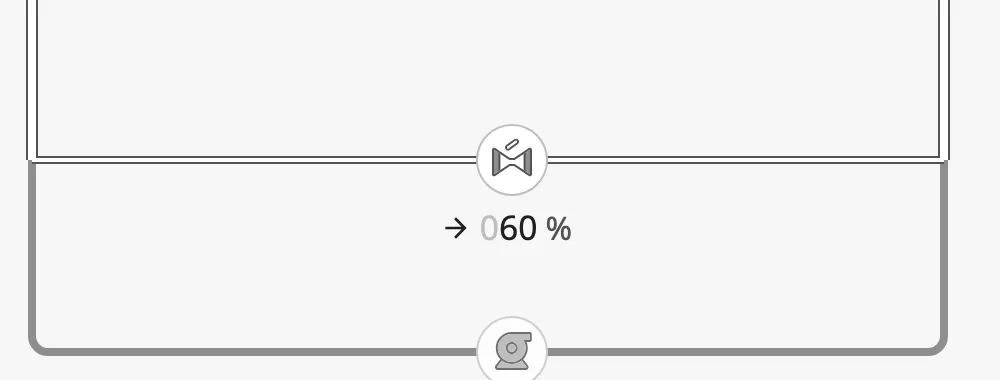 |
medium |
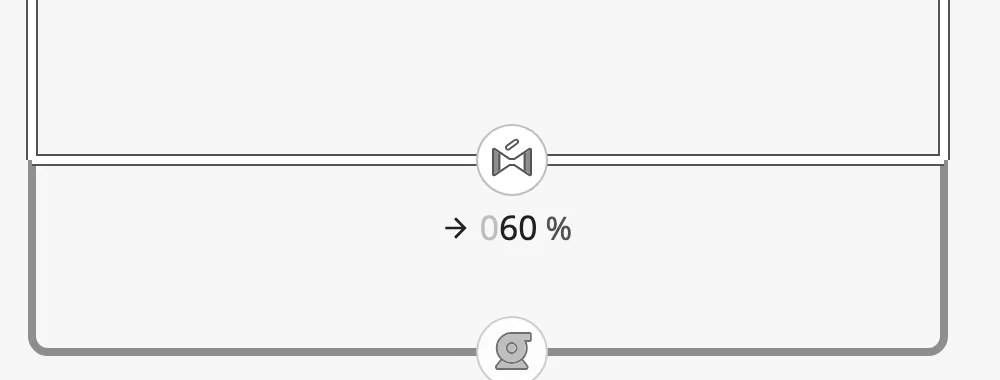 |
large |
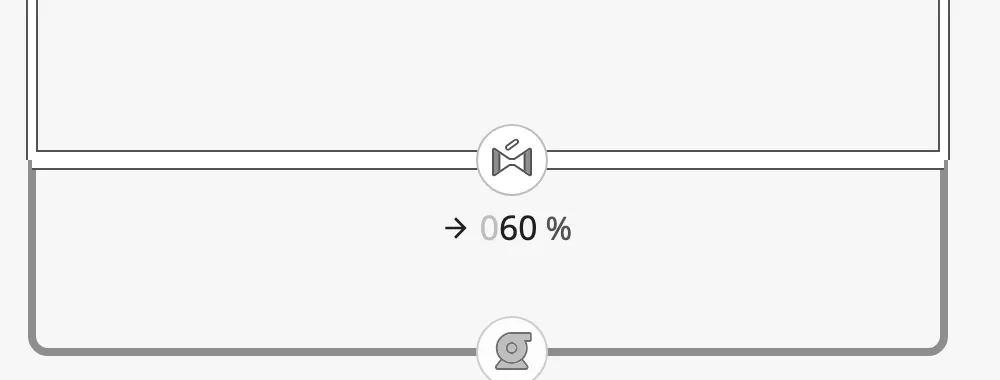 |
xl |
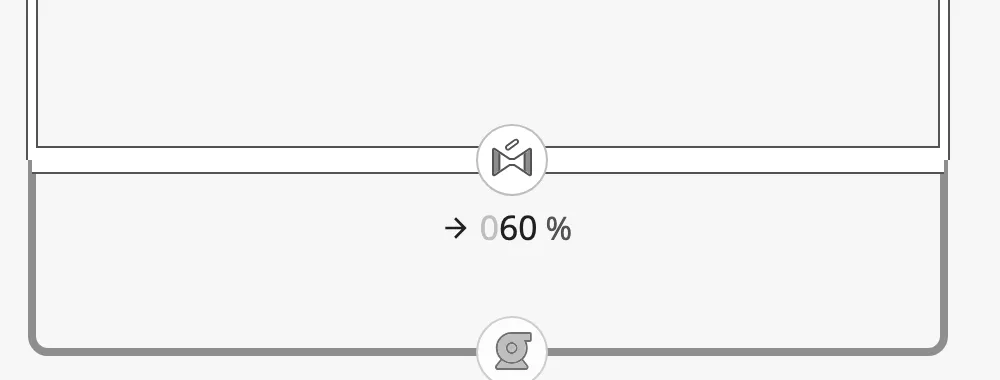 |
Mediums and Colours
Section titled “Mediums and Colours”The medium palette is the list of mediums the diagram carries, each with a name, a colour and a pipe size. Edit it with the ⚙ button in the editing toolbar:
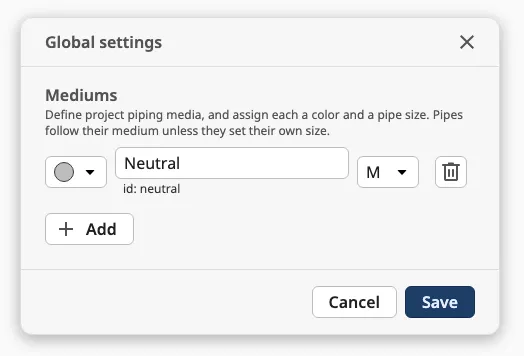
Assign a medium to a pipe with Medium color in the toolbar. Re-colouring a medium in the palette repaints every pipe that carries it.
The colour list shows the ten colours in two columns, and Signal below them.
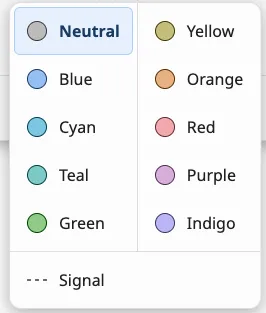
Signal Lines
Section titled “Signal Lines”Choose Signal (the dashed line at the bottom of the colour list) for a medium that is a signal or control line rather than a pipe. Every pipe on that medium:
- is drawn as a dashed grey line, in both view modes and whatever its
state; - keeps its size: S, M, L and XL follow the OpenBridge dashed connector, with solid corners and junctions from L up;
- takes no part in flow: it never carries flow and does not connect the pipes it touches.
A pipe can also be made a signal line directly by setting its mediumColor to
Dashed.
The palette is shared by all diagrams in the project, and is saved in the
project when you save it in the settings: a new diagram starts with the mediums
the project already uses. A project that has never saved a palette starts with a
single Neutral medium. The palette can only be changed from the Designer:
the gateway takes a new palette only from a logged-in Designer, for the project
it has open, so a running session cannot change it. The palette is not a view property. It is
stored in the project folder on the gateway, as
data/projects/<project>/no.openstudio.openbridge/medium-palette/palette.json,
so it follows the project when it is renamed, copied or deleted, and a project
without a palette uses its parent project’s. Palettes from older versions are
moved there automatically the first time a diagram in the project loads: the
older gateway file data/connector-diagram/palettes/<project>.json, and any
userToolbar.mediumColors in the project’s views (mediums the palette does not
already have are added; the views themselves are not changed). The legend of the user toolbar
lists the palette’s mediums that the diagram’s pipes actually use.
View Mode
Section titled “View Mode”viewMode decides how pipes that carry the medium are drawn. In the images, the
valve is open and the pump runs; the lower connection, through the pump, carries
the medium Hot (red) and the rest Cold (blue):
regular (default) — one neutral flow style, whatever the medium:
medium — each pipe in the colour of its medium:
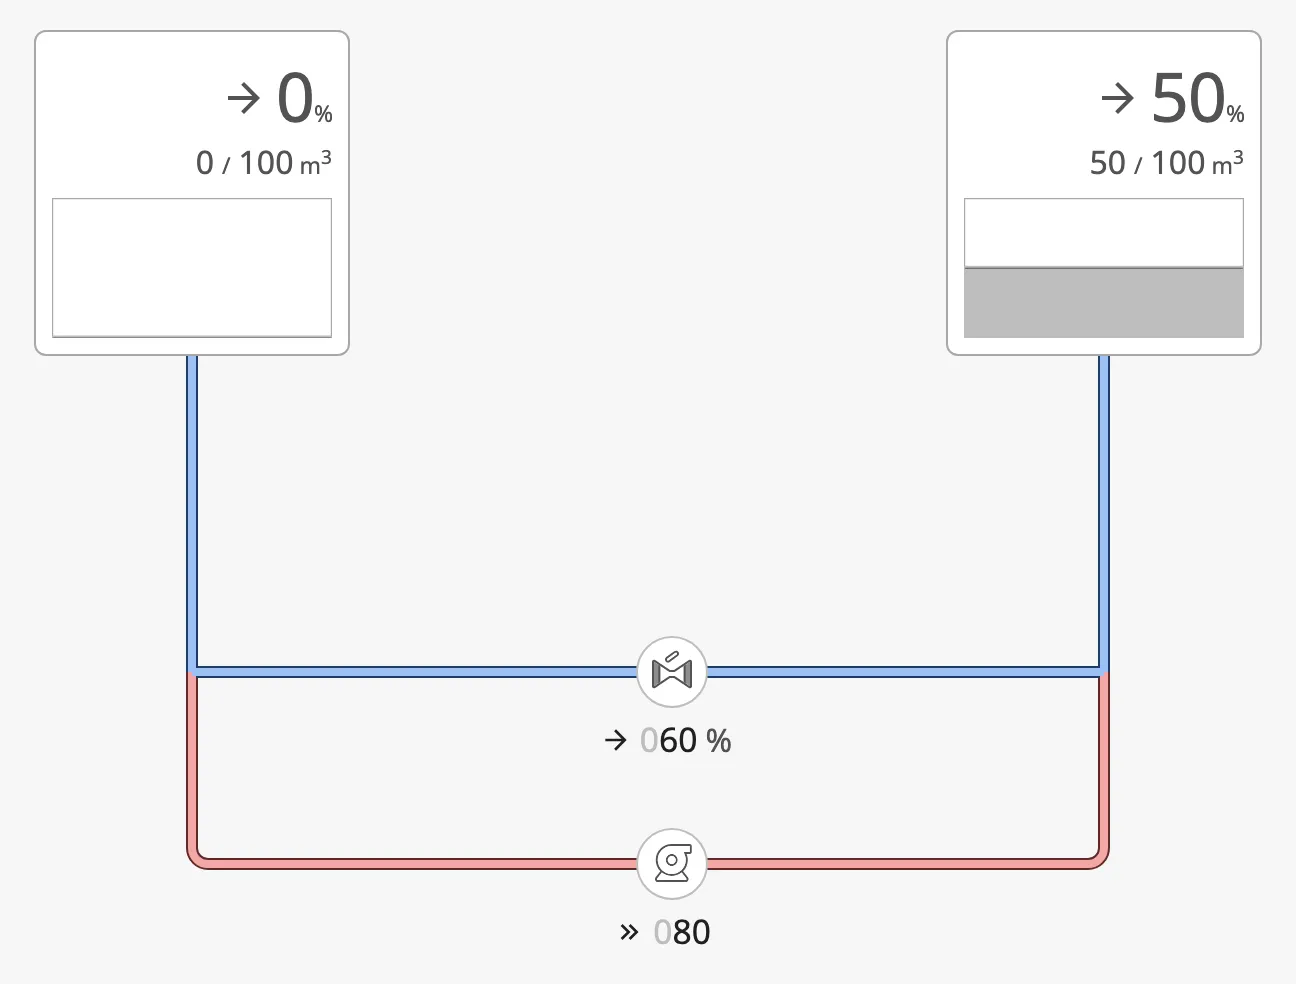
Empty and closed pipes look the same in both modes. Use regular unless the
operator needs to tell the mediums apart; the operator can switch the mode with
Color in the user toolbar.
User Toolbar
Section titled “User Toolbar”At runtime a toolbar at the bottom of the diagram lets the operator change what the diagram shows:

-
Color switches
viewModebetweenmediumandregular. -
The legend lists the mediums with their colours (or On when Color is off), followed by the grey Off swatch. Only mediums that a pipe uses are listed — pipes in this diagram and in any embedded view inside it, however deeply nested. A pipe with a bound
mediumColorcounts for the mediums of that colour. -
ID-tag and Readout switch
userToolbar.showTaganduserToolbar.showReadout. The diagram does not show or hide anything itself: bind the symbols’hasTagandshowReadoutStackto these two properties. -
The zoom button, after a divider, shows the current zoom (for example 100 %) and opens and closes the mini-map above it by switching
minimap.enabled. It is off by default; turn it on withuserToolbar.showZoomToggle. -
The right panel button (off by default, enable it with
userToolbar.showRightPanelOpenButton) sits after a divider at the end of the bar and switchesuserToolbar.rightPanelOpen. Again the diagram only flips the property: open and close the panel yourself, for example with a change script onprops.userToolbar.rightPanelOpen:def valueChanged(self, previousValue, currentValue, origin, missedEvents):# Only react to the button itself (see below).if currentValue is None or origin != 'Browser':returnsessionId = self.session.props.idpageId = self.page.props.pageIdif currentValue.value:system.perspective.openDock('sidemenu', sessionId, pageId)else:system.perspective.closeDock('sidemenu', sessionId, pageId)Set the dock’s show to
onDemandin the page configuration so the panel starts hidden, matching the defaultrightPanelOpen: false.If something else also opens the panel (for example a symbol whose click opens the dock with its own parameters), the button will not know unless you tell it: have that click also send a page message, and set the property from a message handler on the diagram:
# in the symbol's onClick, after the dock actionsystem.perspective.sendMessage('rightPanelOpen', payload={'open': True}, scope='page')# message handler 'rightPanelOpen' on the diagram (page scope)self.props.userToolbar.rightPanelOpen = payload['open']The
origin != 'Browser'check in the change script is what keeps this write from re-opening the dock without the symbol’s parameters.
Properties
Section titled “Properties”userToolbar sub-properties:
| Name | Description | Property Type |
|---|---|---|
| showViewModeToggle | Show the Color button. Default true. |
value |
| showLegend | Show the legend. Default true. |
value |
| showEmptyLegend | Include the colour of an empty pipe in the legend. Default false. |
value |
| showTagToggle | Show the ID-tag button. Default true. |
value |
| showTag | Whether ID-tag is on. Written by the button. Default false. |
value |
| showReadoutToggle | Show the Readout button. Default true. |
value |
| showReadout | Whether Readout is on. Written by the button. Default false. |
value |
| showZoomToggle | Show the divider and zoom button that opens the mini-map. Default false. |
value |
| showRightPanelOpenButton | Show the divider and right panel button at the end of the bar. Default false. |
value |
| rightPanelOpen | Whether the right panel is open. Written by the button. Default false. |
value |
showUserToolbar turns the whole toolbar off.
Sections and Mini-map
Section titled “Sections and Mini-map”Sections are background boxes that group part of the diagram — a room, a deck, a system — with a label on the top edge. Draw them with the Section tool; they never affect the pipes or the flow.
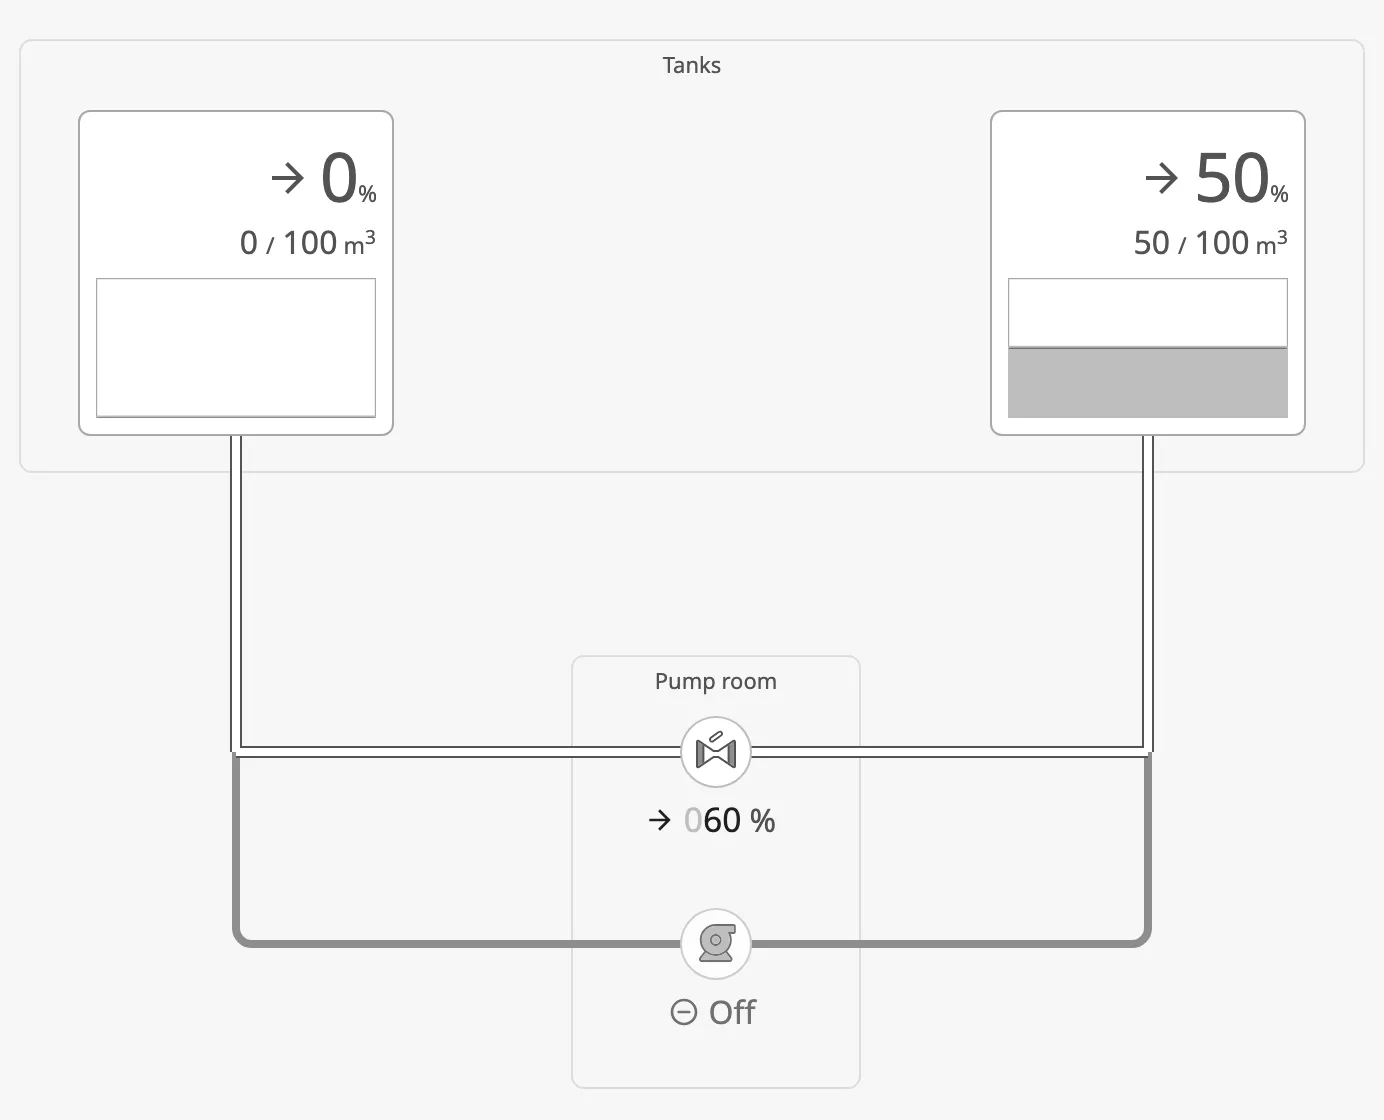
A section with a detail view becomes a card the operator can click at
runtime: its label gets a chevron, it darkens under the pointer and while
pressed (the hover and pressed states of an OpenBridge card, so not in the night
palette, which has none), and a click opens that view in a dialog over the
diagram. Set zones.<id>.detailView to the view, and zones.<id>.viewParams
to extra parameters; the view also receives zoneId and zoneLabel.
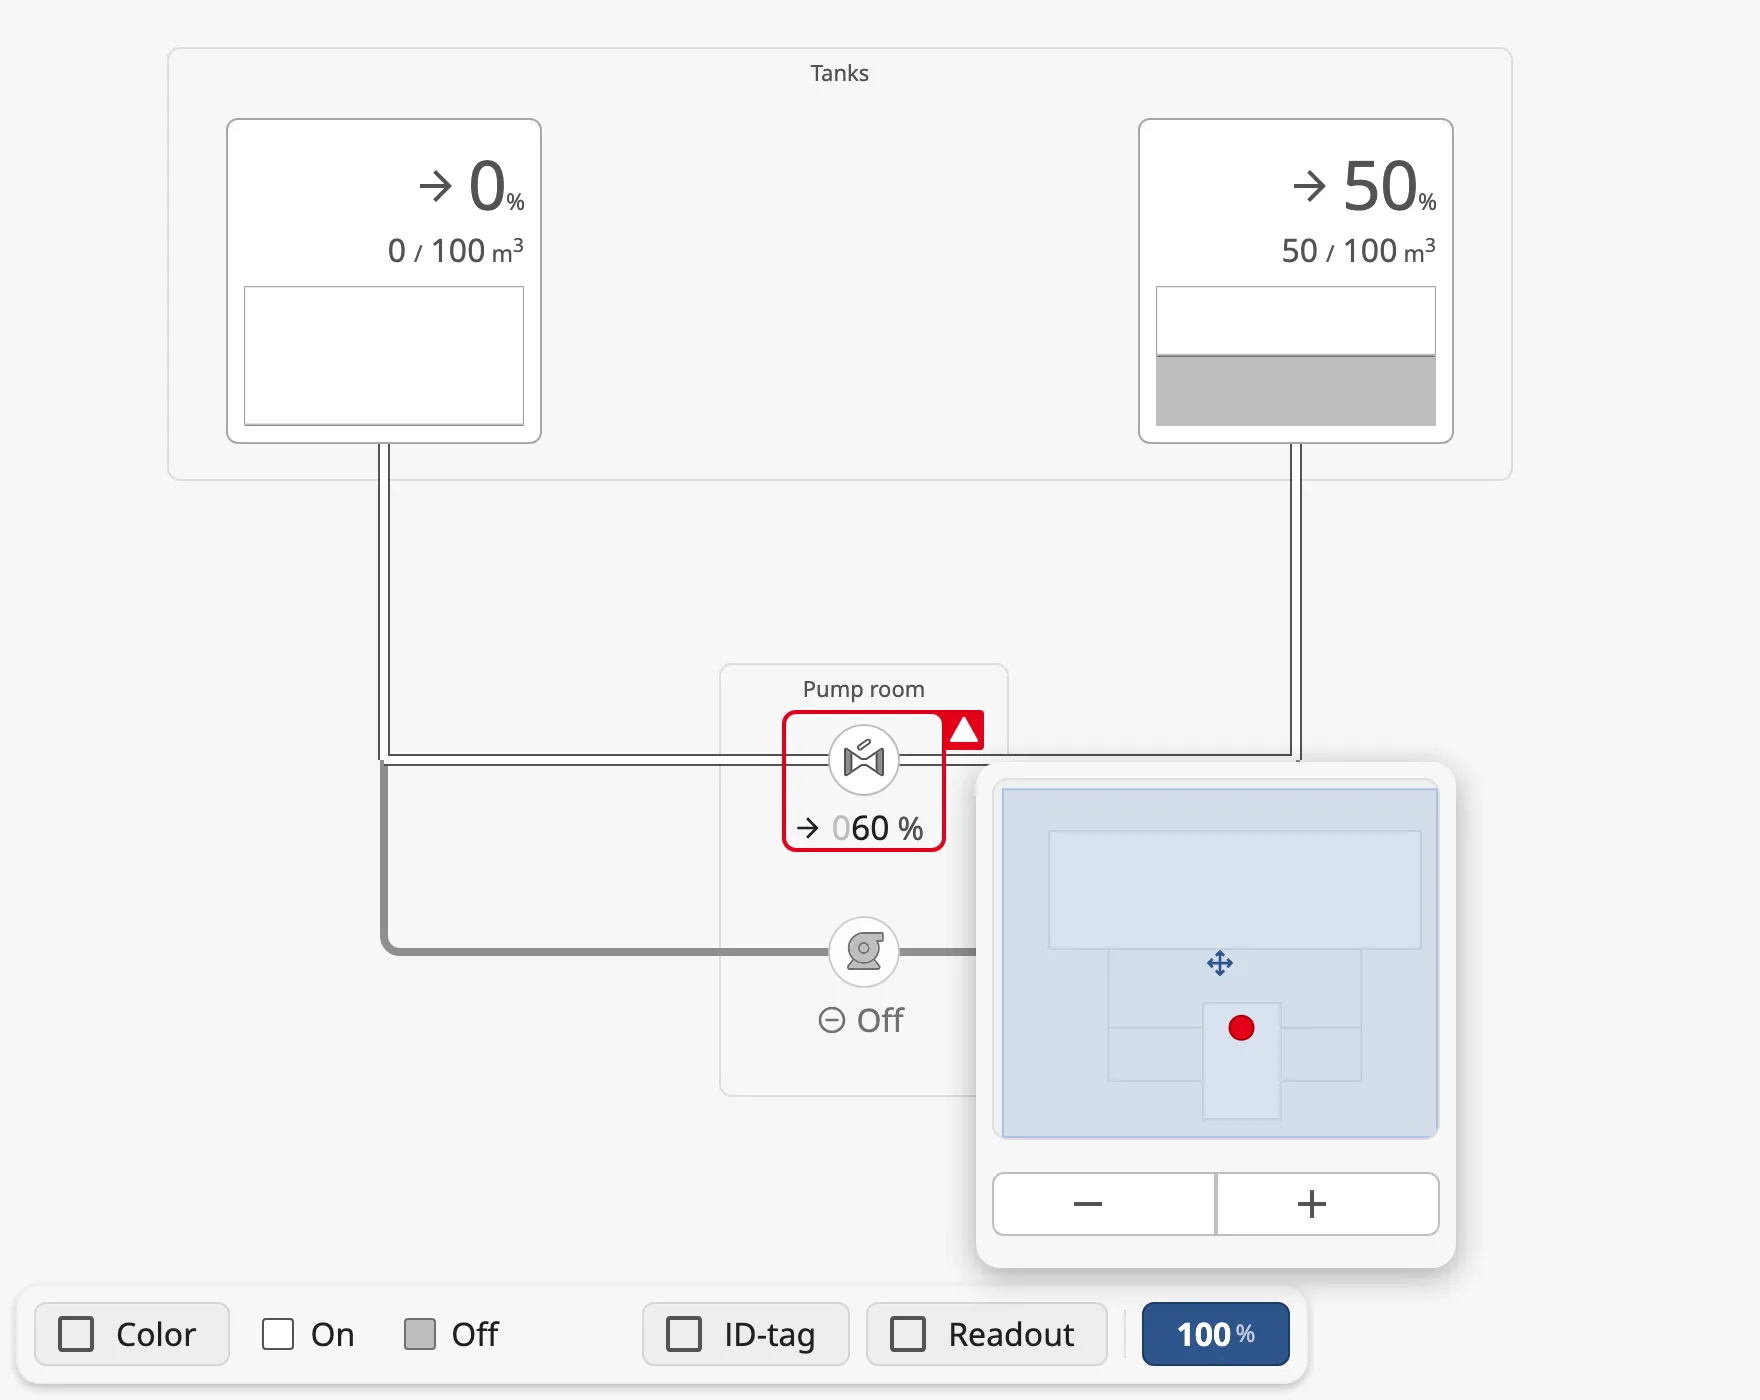
The mini-map is a small overview of the diagram, with − and + zoom
buttons below it. The operator opens and closes it with the zoom button in the
user toolbar, and it pops up above that button; with the zoom
button hidden it sits in the corner set by minimap.corner. Sections are drawn solid on it, and a section with an alerting symbol
inside gets a coloured dot in the colour of the worst alert, so the operator
sees where to look even when that part of the diagram is scrolled out of view.
minimap.enabled holds whether it is open. The − and + buttons zoom
about the middle of the part of the diagram that is in view, so zooming in on a
diagram smaller than the screen stays on the diagram.
Below, the valve has an alert with status level-high (its alert property is
true): the alert frame shows on the valve, and a dot marks the Pump room
section in the mini-map:
Properties
Section titled “Properties”| Name | Description | Property Type |
|---|---|---|
| zones | The sections, keyed by id, each with x, y, w, h, label, detailView and viewParams. zones.<id>.label can be bound. |
object |
| minimap.enabled | Show the mini-map. Default false. |
value |
| minimap.corner | Corner of the mini-map when the toolbar’s zoom button is hidden. Default top-right. |
value |
| view.zoom | Zoom of the diagram, from 0.1 (10 %) to 2 (200 %). Written by the mini-map’s −/+ buttons and the pan and zoom gestures. Default 1. |
value |
Pan and Zoom
Section titled “Pan and Zoom”Turn on view.panZoom to let the operator move around a large diagram the way
they move around a map, with a mouse, a laptop trackpad or a touch screen:
| Gesture | What it does |
|---|---|
| Mouse wheel, or pinch on a trackpad | Zooms in or out about the pointer. |
| Drag the empty background (mouse or one finger) | Pans the diagram. |
| Two fingers on a touch screen | Pinch to zoom, move both fingers to pan. |
| Double click or double tap the background | Zooms in about that point (Shift: zooms out). |
The zoom stays between 10 % and 200 % and is written to view.zoom, so the
mini-map and the toolbar’s zoom button follow it. Like a map, a zoom keeps the
point under the pointer where it is, even at the diagram’s edge: zooming in cuts
off the side of the diagram away from the pointer, and zooming out leaves empty
space beside it. The empty space is capped at 20 % of the diagram’s frame on
each side; once a zoom or a drag reaches it, the
view stops there and the pointer no longer holds its point. During one zoom
with the wheel or a trackpad, a side that reached the limit stays put until
the zoom has rested for 400 ms, so the view changes direction at most twice. A diagram smaller
than its frame always shows some empty space; it can then sit anywhere in view.
Zooming out further than needed to see everything springs back, like a rubber band. Past the fit zoom (the largest zoom that shows the whole diagram) a zoom-out meets more and more resistance and never goes below half the fit zoom. When the gesture ends (the fingers lift, or the wheel stops), the view animates back to the fit zoom with the diagram centred. The − button does the same.
A drag that starts on a symbol does not pan: the symbol keeps its own clicks and drags. A drag across a section card does not open the card.
With view.panZoom on, the wheel always zooms the diagram and never scrolls the
page, and the diagram scrolls itself. Leave it off for a diagram inside another
view (a symbol), so the outer diagram gets the gestures. The gestures only work
at runtime, not in the Designer.
Properties
Section titled “Properties”| Name | Description | Property Type |
|---|---|---|
| view.panZoom | Turn on the pan and zoom gestures at runtime. Default false. |
value |
Properties
Section titled “Properties”Properties not covered in the sections above:
| Name | Description | Property Type |
|---|---|---|
| editable | Allow drawing and changing pipes in the Designer. Default true. Pipes are never editable at runtime. |
value |
| gridSize | Grid, in px, that loose pipe ends snap to, and the spacing of the extra connection points on large symbols. Default 24. |
value |
| viewMode | regular or medium. See View Mode. Default regular. |
value |
| flow | flow.enabled turns the flow on or off. Default on. |
object |
| connections | The pipes, keyed by id. See Finding a Pipe. | object |
| nodes | The junctions (T and cross) the pipes share. Maintained by the editor. | object |
| style | Standard Perspective style object. | object |
Component Events
Section titled “Component Events”| Event | Description | Event Object |
|---|---|---|
| onZoneExpanded | Fired when a section card opens its detail view. | See below |
| onZoneCollapsed | Fired when the detail view closes. | See below |
The event object of onZoneExpanded:
| Name | Description | Property Type |
|---|---|---|
| zoneId | Id of the section: its key in zones. |
value |
| label | label of the section, or empty if it has none. |
value |
The event object of onZoneCollapsed:
| Name | Description | Property Type |
|---|---|---|
| zoneId | Id of the section: its key in zones. |
value |
| reason | What closed the detail view: close-button (its close button), outside (a click outside the dialog), escape (the Escape key) or removed (the section was removed from zones). |
value |
Examples
Section titled “Examples”Example 1 — Fuel Transfer Between Two Tanks
Section titled “Example 1 — Fuel Transfer Between Two Tanks”- Drop a Connector Diagram into a view and make it the size of the view.
- Drop two Automation Tanks, an Analog Valve and a Pump onto it.
Name them
TankA,TankB,TransferValveandTransferPump. - Bind each tank’s
valueto its level tag, the valve’sopento the valve feedback and the pump’sonto the pump’s running signal. - Draw a pipe from the bottom of
TankAto the left ofTransferValve, and on from its right to the bottom ofTankB. Draw a second path throughTransferPump, joining the first pipes with T junctions. - In the ⚙ settings, add a medium
Fuelwith a colour, select the pipes and choose Fuel as their medium.
In a session, the pipes through the valve show flow when the valve opens, and
those through the pump when it runs. Nothing more is bound. Set viewMode to
medium, or let the operator press Color, to see them in the fuel colour.
Example 2 — Show a Pipe as Closed
Section titled “Example 2 — Show a Pipe as Closed”-
Select the diagram and click the pipe on the canvas; the pipe panel shows its id, for example
cmummicfa1. -
Click Bind… next to
state, and bind it with an expression:if({[default]Fuel/Line2/OutOfService}, 'closed', 'open')
While the tag is true, the pipe is drawn closed, and no flow passes it.
Found an error or something unclear?
Tell us what is wrong, confusing or missing on this page.
Built on the OpenBridge Design System