Gauge Horizontal
The Gauge Horizontal shows a value as a bar that fills a horizontal track, above or below a scale. It is found in the Maritime - OpenBridge section of the Perspective Component Palette as Gauge Horizontal.
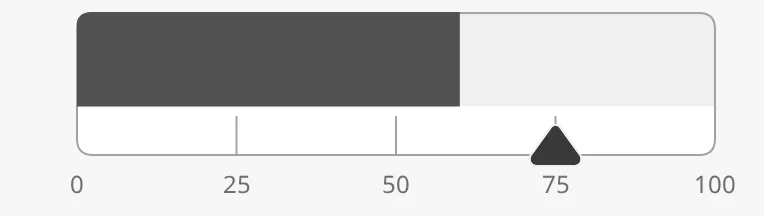
The parts of the gauge:
- Bar — filled up to the value. See Value and Range and Fill.
- Scale — the band beside the bar, with tickmarks and labels. See Scale.
- Setpoint — a marker on the scale. See Setpoint.
The Gauge Horizontal is the horizontal form of the Gauge Vertical: the two have the same properties and work in the same way. It is one of the maritime instruments; state, priority, the setpoint and advice zones are shared by all of them and are described in Maritime Instruments — Common Features. This page covers what is specific to the Gauge Horizontal.
A Gauge Horizontal dropped from the palette has no value and an empty track:
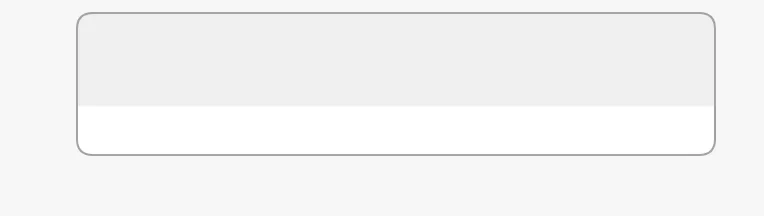
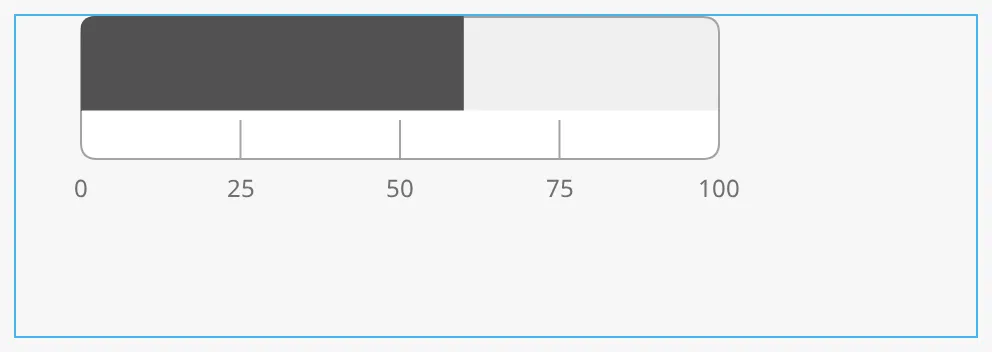
The gauge has a fixed size: it takes up 384 × 132 px at the top left of the component’s box, and does not grow or shrink with the box. The bar itself is 320 px long and starts 32 px from the left edge; the labels are drawn in the room beside it. Make the box at least 384 px wide, or the right end of the gauge is cut off. The blue frame is the component’s box:
Value and Range
Section titled “Value and Range”Set hasValue to true and bind value to the quantity to show. minValue
and maxValue are the ends of the scale.
| Setting | Image |
|---|---|
value = 60, 0 to 100 |
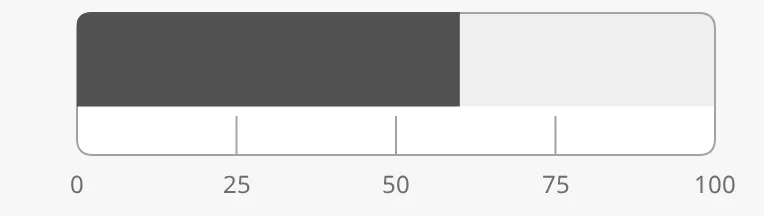 |
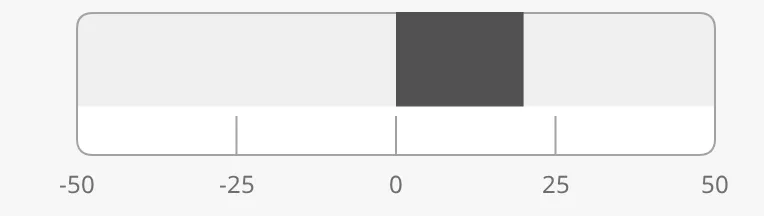
value = 20, −50 to 50 |
 |
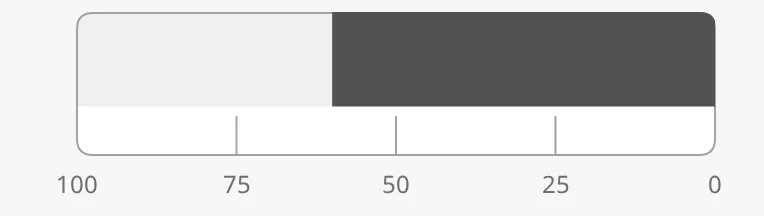
reverse = true |
 |
The bar is drawn from zero, so with a range that spans zero it grows to the left
or right of the zero line. With reverse the scale is turned around: minValue
is at the right and the values grow to the left.
Properties
Section titled “Properties”| Name | Description | Property Type |
|---|---|---|
| hasValue | Show a value. Default false. |
value |
| value | The value. Only shown when hasValue is true. |
value |
| minValue | Lowest value of the scale. Default 0. |
value |
| maxValue | Highest value of the scale. Default 100. |
value |
| reverse | Put minValue at the right. Default false. |
value |
fillMode selects how the value is drawn:
| fillMode | Image |
|---|---|
fill (default) |
|
tint |
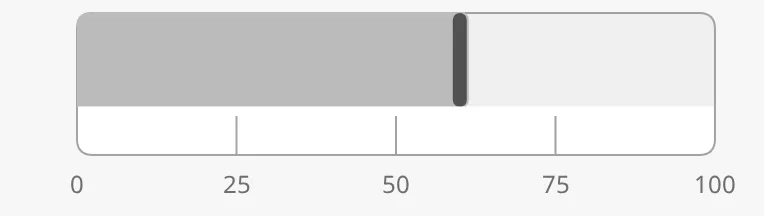 |
fill— a solid bar up to the value.tint— a lighter bar with a marker line at the value, which makes the value itself stand out.
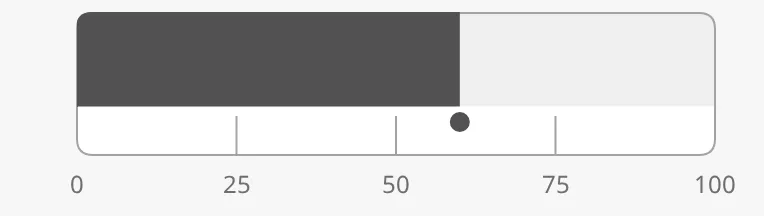
highlightCurrentValue adds a dot at the value, in the scale band:
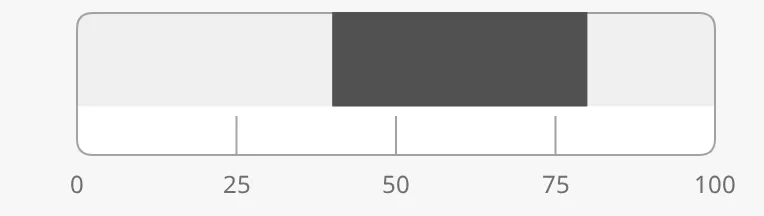
The bar normally runs from zero to the value. fillMin and fillMax give it
other ends, for showing a range instead of a level:
Properties
Section titled “Properties”| Name | Description | Property Type |
|---|---|---|
| fillMode | fill or tint. Default fill. |
value |
| highlightCurrentValue | Mark the value with a dot in the scale band. Default false. |
value |
| hasFillMin | Give the bar another start than zero. Default false. |
value |
| fillMin | Start of the bar. Only shown when hasFillMin is true. |
value |
| hasFillMax | Give the bar another end than the value. Default false. |
value |
| fillMax | End of the bar. Only shown when hasFillMax is true. |
value |
side places the scale below (bottom, the default) or above (top) the bar:
| side | Image |
|---|---|
bottom (default) |
|
top |
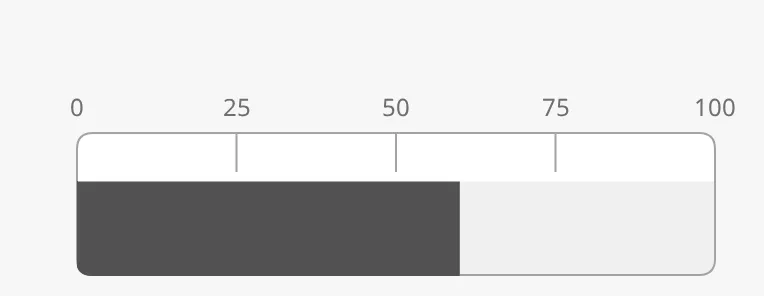 |
With the scale on top the whole gauge moves down in its 132 px, to leave room
for the labels above it. The values left and right belong to the
Gauge Vertical; on this gauge they draw the scale on
top, as top does.
The scale is empty until tickmarks are turned on. There are three levels, each
with a has… property that turns it on and an interval, and a list of single
values. They work as on the Gauge Vertical:
| Tickmarks | Image |
|---|---|
| Primary, every 25 | |
| Primary 25, secondary 5, tertiary 1 | 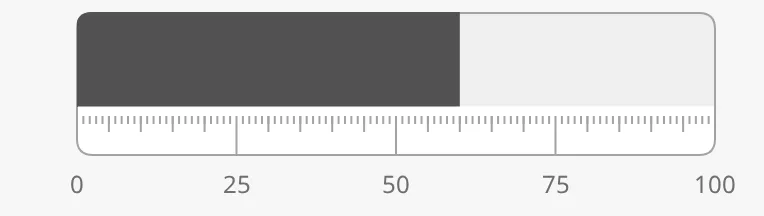 |
mainTickmarks = [0, 50, 100] |
 |
- Primary tickmarks are the longest and carry the labels.
showLabelsturns the labels off. - Secondary and tertiary tickmarks are shorter and have no labels.
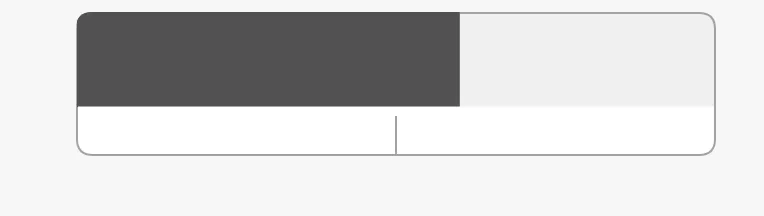
mainTickmarksis a list of single values to mark, without labels. A tickmark at an end of the scale falls on the frame and is not seen.
Joining Gauges
Section titled “Joining Gauges”borderRadiusPosition selects which corners of the gauge are rounded, for
placing several gauges next to each other as one instrument:
| borderRadiusPosition | Image |
|---|---|
innerFirstChild (default) |
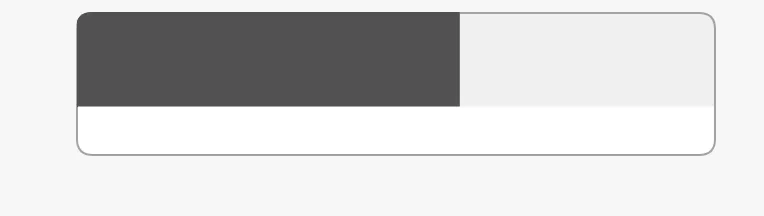 |
middleChild |
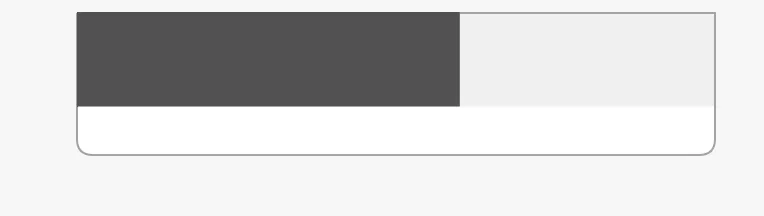 |
middleRoundedChild |
|
outerLastChild |
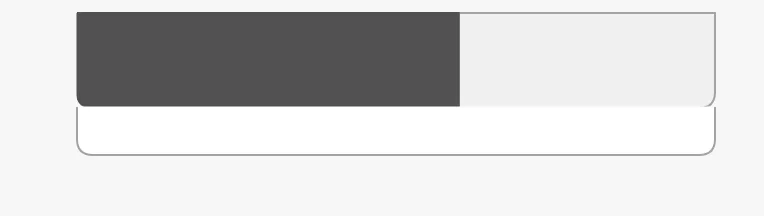 |
Properties
Section titled “Properties”| Name | Description | Property Type |
|---|---|---|
| side | Side of the bar the scale is on: bottom or top. Default bottom. |
value |
| showLabels | Show the numbers at the primary tickmarks. Default true. |
value |
| hasPrimaryTickmarkInterval | Show primary tickmarks. Default false. |
value |
| primaryTickmarkInterval | Distance between primary tickmarks. Only shown when hasPrimaryTickmarkInterval is true. |
value |
| hasSecondaryTickmarkInterval | Show secondary tickmarks. Default false. |
value |
| secondaryTickmarkInterval | Distance between secondary tickmarks. Only shown when hasSecondaryTickmarkInterval is true. |
value |
| hasTertiaryTickmarkInterval | Show tertiary tickmarks. Default false. |
value |
| tertiaryTickmarkInterval | Distance between tertiary tickmarks. Only shown when hasTertiaryTickmarkInterval is true. |
value |
| mainTickmarks | Single values to mark on the scale. Empty by default. | array |
| borderRadiusPosition | Which corners are rounded: innerFirstChild, middleChild, middleRoundedChild or outerLastChild. auto leaves the choice to the component. Default innerFirstChild. |
value |
Setpoint and Advice Zones
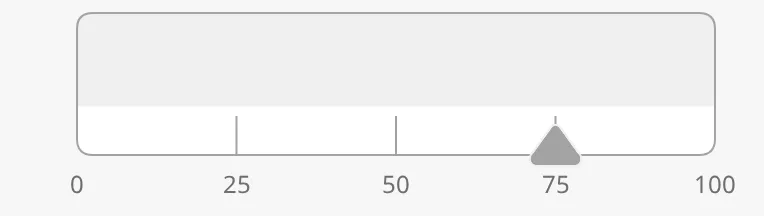
Section titled “Setpoint and Advice Zones”The setpoint works as described in Setpoint. The marker sits in the scale band and points at the bar:
| Setpoint | Image |
|---|---|
| Setpoint at 75 | |
| A new setpoint being chosen | 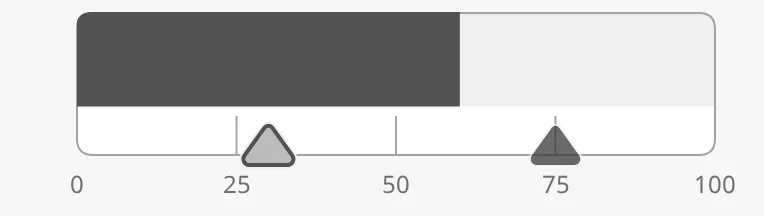 |
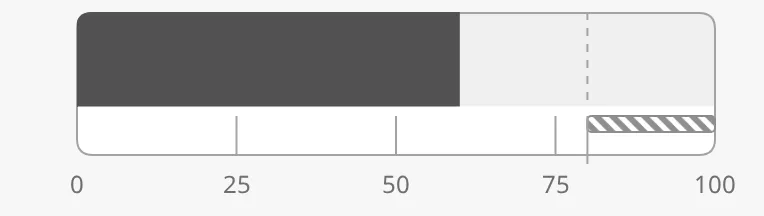
advices is a list of advice zones, each with
min and max in the unit of the scale. A zone is triggered when the value or
the setpoint is inside it; adviceTrigger narrows that to one of them:
State and Priority
Section titled “State and Priority”| Setting | Image |
|---|---|
active |
|
loading |
 |
off |
|
priority = enhanced |
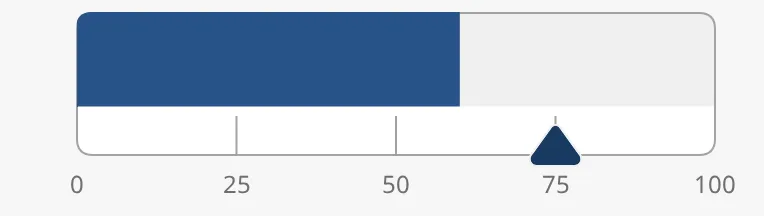 |
In the loading and off states the bar is not drawn. See
State and Priority.
Common Properties
Section titled “Common Properties”These work in the same way on every maritime instrument, and are described in Maritime Instruments — Common Features:
- State —
state. - Priority —
priority. - Setpoint —
hasSetpoint,setpoint,autoAtSetpoint,autoAtSetpointDeadband,atSetpoint,touching,hasNewSetpoint,newSetpoint,animateSetpoint,setpointAtZeroDeadband,setpointOverride. - Advice Zones —
advices,adviceTrigger,adviceEmphasis. - Style and Events —
style.
focused is deprecated; use touching.
Component Events
Section titled “Component Events”The Gauge Horizontal has no component events of its own.
Examples
Section titled “Examples”Example 1 — Engine Load with a Limit
Section titled “Example 1 — Engine Load with a Limit”- Drop a Gauge Horizontal into the view and make it 384 × 132 px.
- Set
hasValuetotrueand bindvalueto[default]Engine/ME1/Load. - Set
hasPrimaryTickmarkIntervaltotrueandprimaryTickmarkIntervalto25. - Set
advicesto[{"category": "caution", "min": 85, "max": 100}].
Found an error or something unclear?
Tell us what is wrong, confusing or missing on this page.
Built on the OpenBridge Design System