Gauge Trend
The Gauge Trend shows the recent history of a value as a line, next to a vertical scale with the current value. It is found in the Maritime - OpenBridge section of the Perspective Component Palette as Gauge Trend.
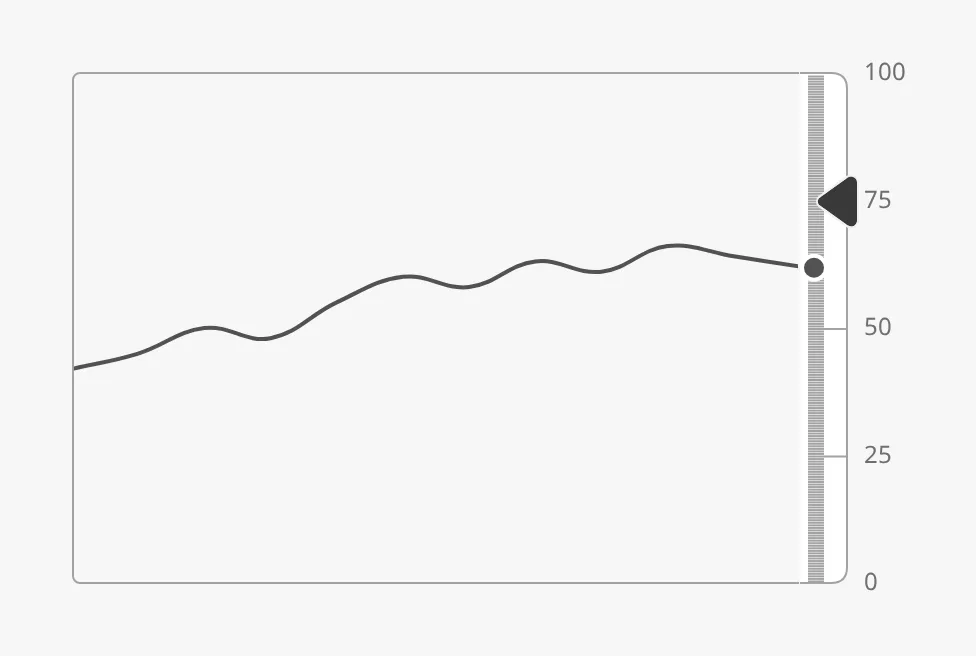
The parts of the instrument:
- Chart — the history line. See Data and Chart.
- Scale — the vertical scale at the right, with the current value as a dot or a bar. See Scale and Value.
- Setpoint — a marker on the scale. See Setpoint.
The Gauge Trend is one of the maritime instruments. State, priority, the setpoint and advice zones are shared by all of them and are described in Maritime Instruments — Common Features. This page covers what is specific to the Gauge Trend. For a small symbol of the same kind, see the Gauge Trend Indicator.
A Gauge Trend dropped from the palette has no data and no scale, and shows an empty frame on the instrument background. It scales with the width of its box; see Size.
data is the history to draw. It can be:
- a dataset, for example from a tag history binding: the first date column is the time and the first other column the values; or
- an object with a list of values,
{"xValues": [...], "yValues": [...]}. OnlyyValuesis used.
The values are drawn in order, evenly spaced from left to right, whatever their timestamps: there is no time axis. With only data and no scale:
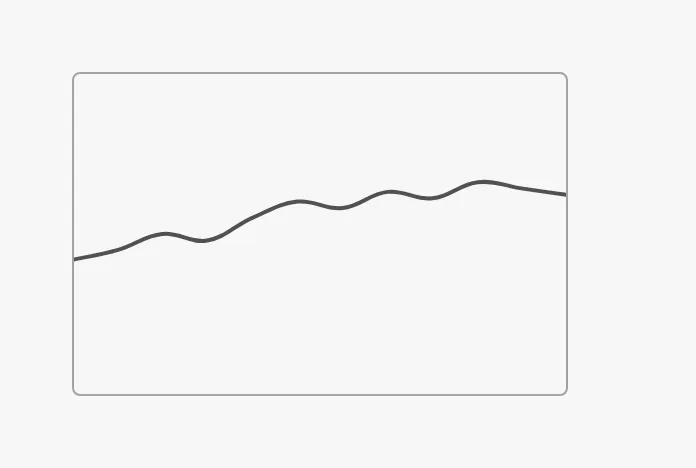
Note: The images on this page were made with the object form of
data. The dataset form was not tried for this page.
Properties
Section titled “Properties”| Name | Description | Property Type |
|---|---|---|
| data | The history: a dataset, or an object with xValues and yValues. Empty lists by default. |
object |
Scale and Value
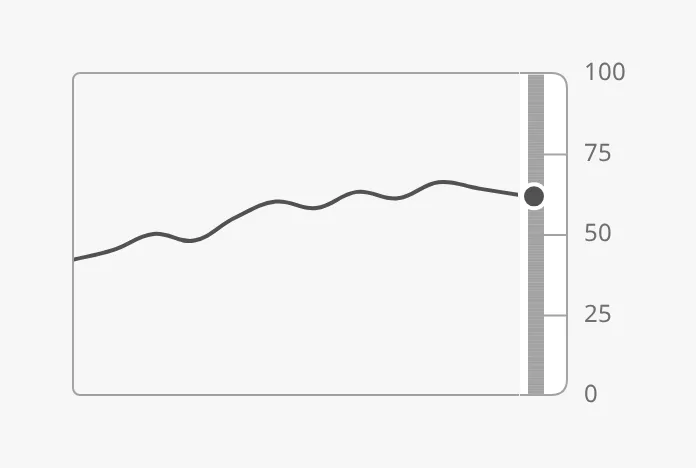
Section titled “Scale and Value”Set hasScale to true to draw the scale at the right, and hasValue to
true with value bound to the current value. The value is a dot on the
scale; with hasBar it is a bar instead. minValue and maxValue are the
bottom and top of both the scale and the chart.
| Scale with the value as a dot |
|---|
 |
hasBar = true |
|---|
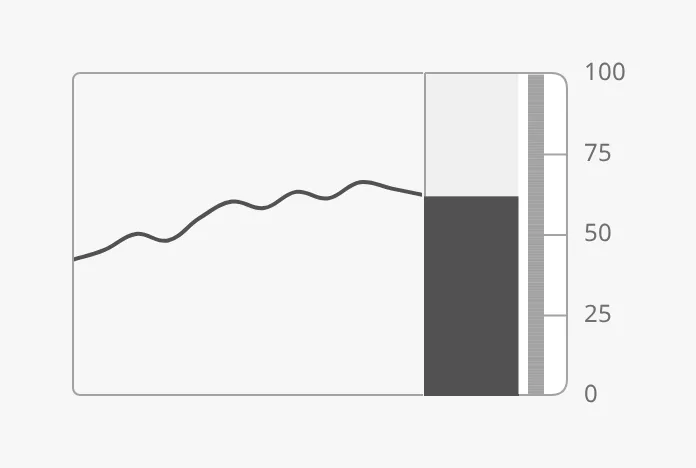 |
The bar runs from fillMin (default 0) to the value. With fillMode set to
tint, it is a lighter band from fillMin to fillMax with a marker at the
value — here from 40 to 80:
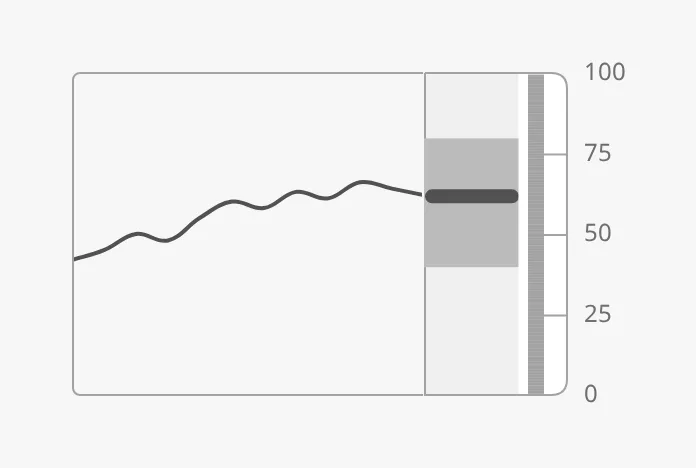
With hasScale set to false the band and the value are hidden, but the
labels stay.
Tickmarks
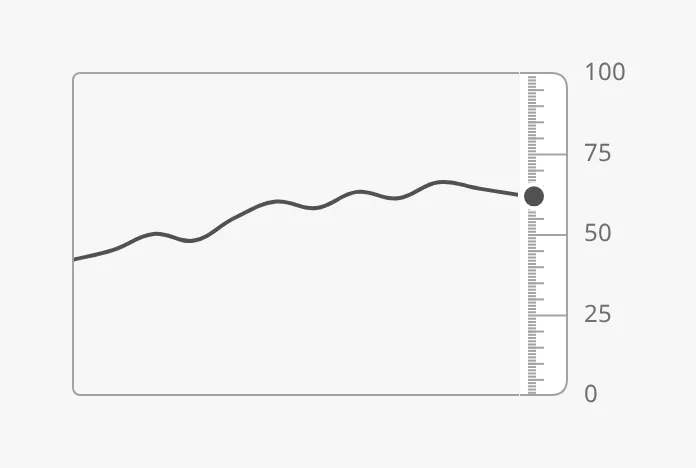
Section titled “Tickmarks”The labels are at the primary tickmarks: turn them on with
hasPrimaryTickmarkInterval. secondaryTickmarkInterval and
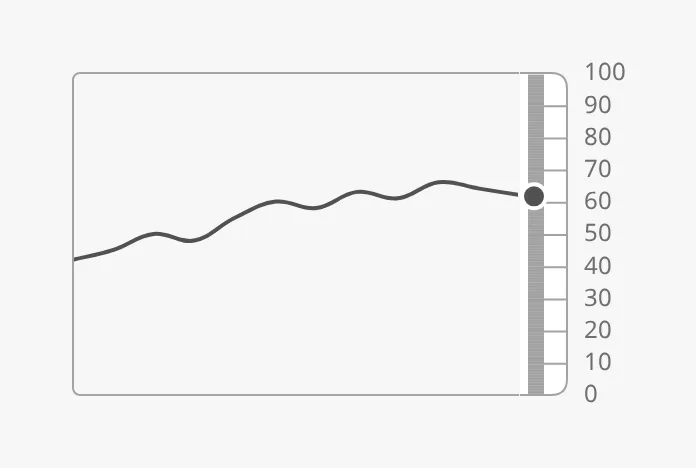
tertiaryTickmarkInterval add shorter tickmarks. yStepSize also sets the
distance between the labels. scaleType condensed draws a narrower band.
| All three levels (25, 5, 1) |
|---|
 |
yStepSize = 10 |
|---|
 |
scaleType = regular (default) |
|---|
|
scaleType = condensed |
|---|
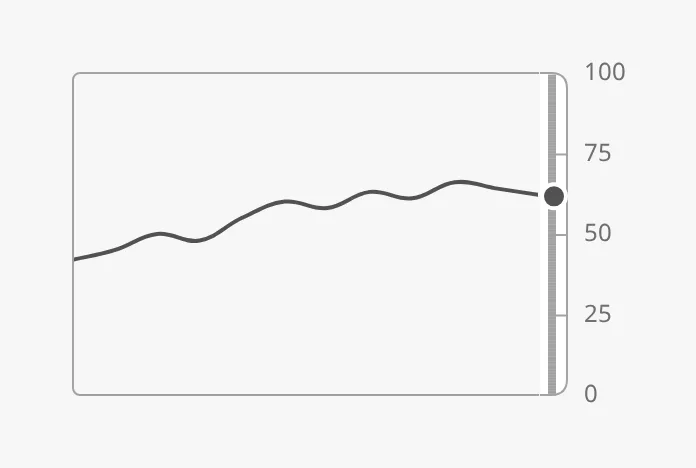 |
Properties
Section titled “Properties”| Name | Description | Property Type |
|---|---|---|
| hasScale | Draw the scale band and the value. Default false. |
value |
| hasValue | Show a current value. Default false. |
value |
| value | The current value. Only shown when hasValue is true. |
value |
| minValue | Bottom of the scale and the chart. Default 0. |
value |
| maxValue | Top of the scale and the chart. Default 100. |
value |
| hasBar | Show the value as a bar instead of a dot. Default false. |
value |
| fillMode | fill or tint. Default fill. |
value |
| fillMin | Start of the bar. Default 0. |
value |
| hasFillMax | Give the tinted band another end than the value. Default false. |
value |
| fillMax | End of the tinted band, with fillMode tint. Only shown when hasFillMax is true. |
value |
| scaleType | regular or condensed. Default regular. |
value |
| hasPrimaryTickmarkInterval | Show primary tickmarks and labels. Default false. |
value |
| primaryTickmarkInterval | Distance between primary tickmarks. Only shown when hasPrimaryTickmarkInterval is true. |
value |
| secondaryTickmarkInterval | Distance between secondary tickmarks. Default 0.5. |
value |
| hasTertiaryTickmarkInterval | Show tertiary tickmarks. Default false. |
value |
| tertiaryTickmarkInterval | Distance between tertiary tickmarks. Only shown when hasTertiaryTickmarkInterval is true. |
value |
| hasYStepSize | Set the distance between the labels. Default false. |
value |
| yStepSize | Distance between the labels. Only shown when hasYStepSize is true. |
value |
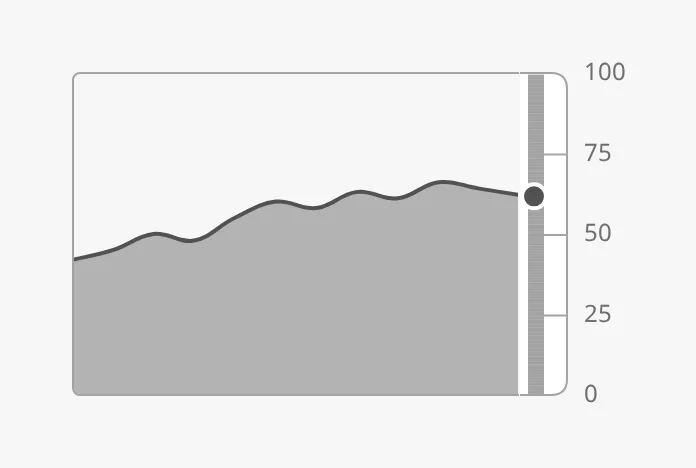
chartFill = true |
|---|
 |
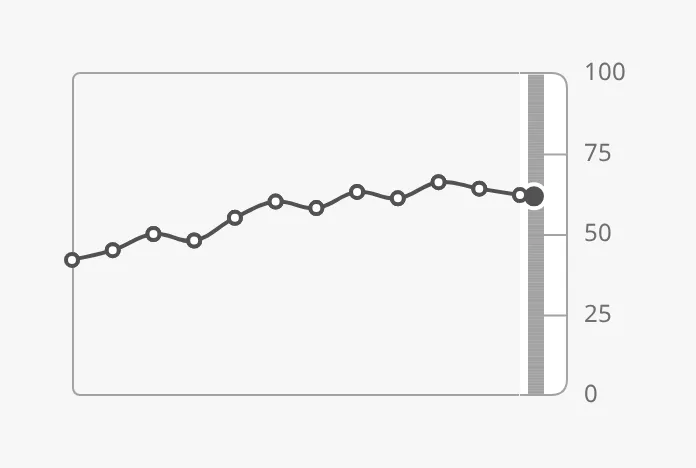
showPoints = true |
|---|
 |
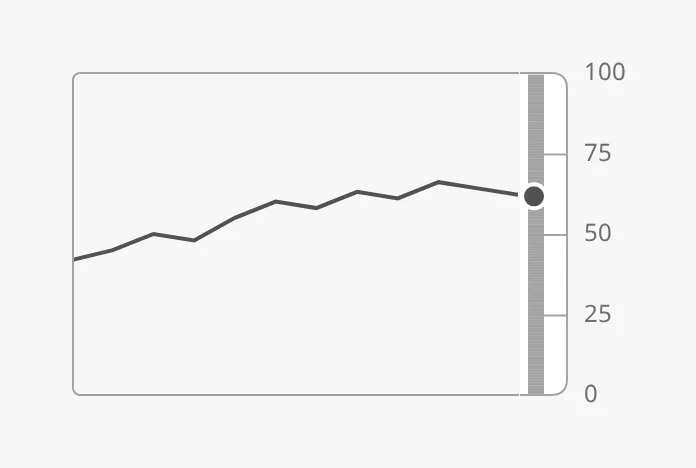
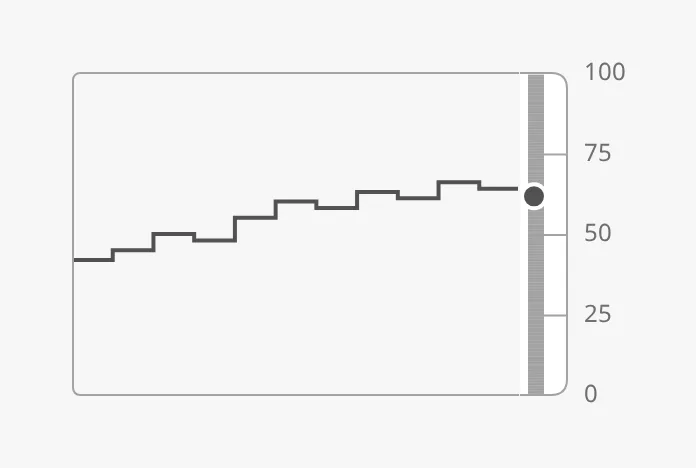
lineMode selects how the points are joined:
smooth (default) |
|---|
|
straight |
|---|
 |
stepped |
|---|
 |
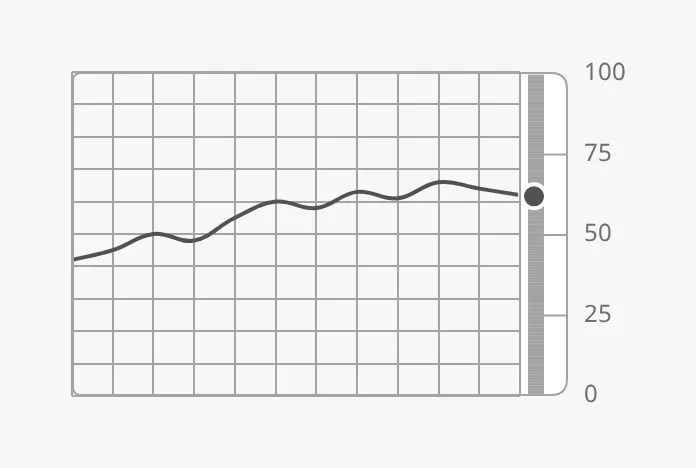
A grid is drawn when showGrid is true and showGridX (vertical lines)
or showGridY (horizontal lines) is true; showGrid alone draws nothing.
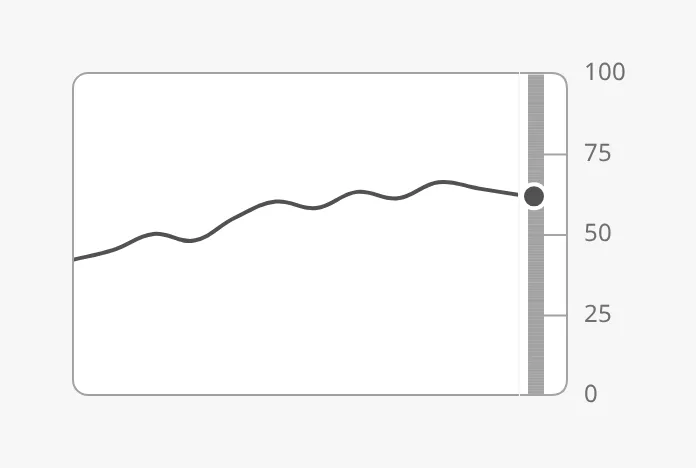
instrumentMode gives the chart a white background:
Grid (showGrid, showGridX, showGridY) |
|---|
 |
instrumentMode = true |
|---|
 |
Properties
Section titled “Properties”| Name | Description | Property Type |
|---|---|---|
| chartFill | Fill the area under the line. Default false. |
value |
| lineMode | smooth, straight or stepped. Default smooth. |
value |
| showPoints | Mark each value with a point. Default false. |
value |
| showGrid | Turn the grid on. Default false. |
value |
| showGridX | Vertical grid lines. Only shown when showGrid is true. Default false. |
value |
| showGridY | Horizontal grid lines. Only shown when showGrid is true. Default false. |
value |
| instrumentMode | Draw the chart on the instrument background with rounded corners. On for a new drop; false for older views that don’t set it. |
value |
Setpoint and Advice Zones
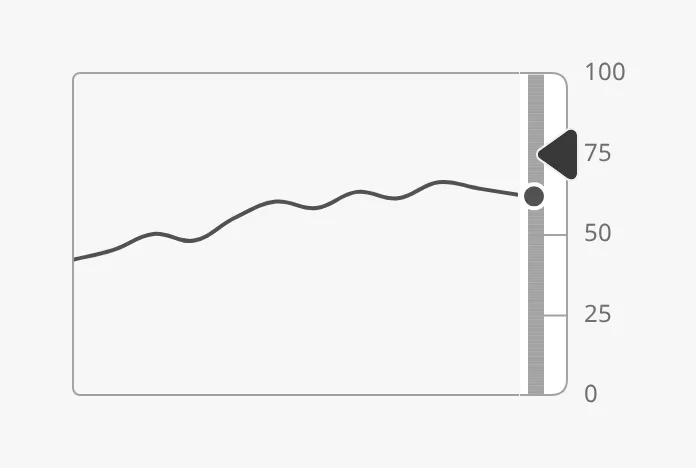
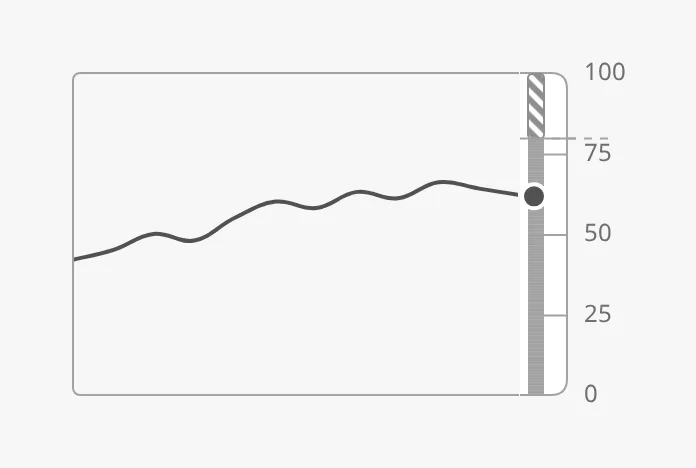
Section titled “Setpoint and Advice Zones”The setpoint works as described in Setpoint. The marker sits on the scale:
Advice zones are drawn on the scale when hasAdvice is true. Note that the
list is called advice here (not advices), and the ends of a zone are min
and max. See Advice Zones.
Properties
Section titled “Properties”| Name | Description | Property Type |
|---|---|---|
| hasAdvice | Draw the advice zones. Default false. |
value |
| advice | The zones, each with min, max, type and hinted. |
array |
State and Priority
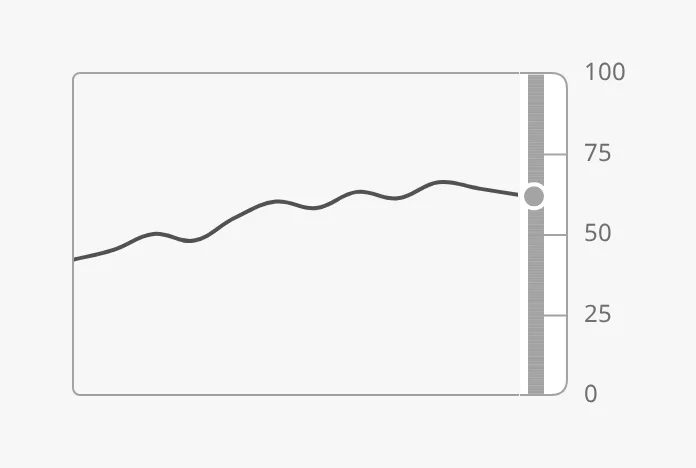
Section titled “State and Priority”The state only changes the value on the scale, which is dimmed in the loading
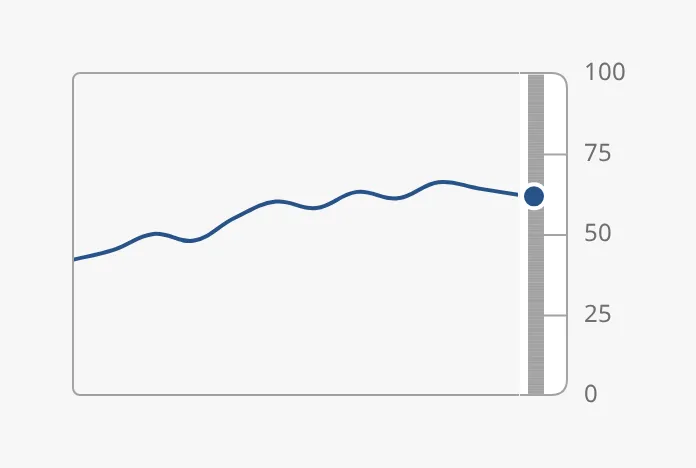
and off states; the line is drawn as before. priority enhanced draws the
line and the value in the enhanced colour.
active |
|---|
|
off |
|---|
 |
loading |
|---|
|
priority = enhanced |
|---|
 |
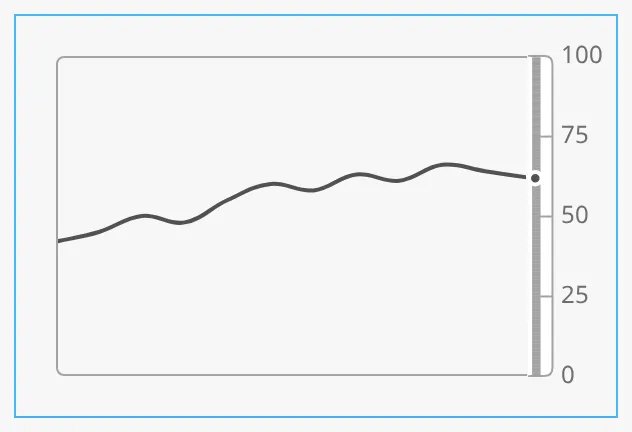
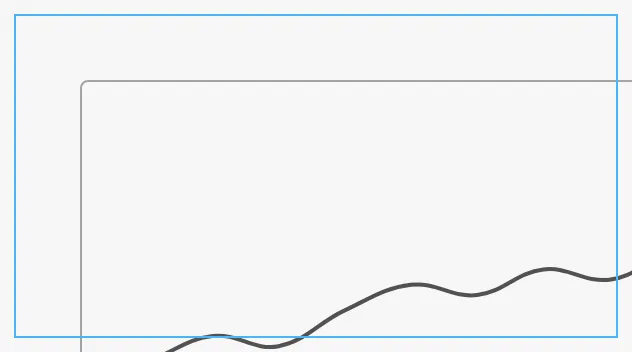
A new Gauge Trend drops as 480 × 320 px with fixedAspectRatioScaling on: the
trend scales to the width of the box, keeping the proportions of width ×
height, and the labels scale with it. scaleReferenceSize is the width at
which it is drawn at its natural size (default 384); a smaller number makes
the scale band and labels larger. The blue frame is the component’s box, here
300 × 160 px:
With fixedAspectRatioScaling off, the trend is drawn at width × height
pixels (default 480 × 320) at the top left of the box, whatever the box’s size:
in a smaller box it is cut off, and in a larger box the rest is empty. Gauge
Trends from before this default changed are drawn this way; tick
fixedAspectRatioScaling to make them scale.
Below about 340 px wide the labels of the scale no longer fit. With
hasLabelPadding set to false the chart takes the whole area and the labels
are cut off.
Properties
Section titled “Properties”| Name | Description | Property Type |
|---|---|---|
| width | Width of the drawing in pixels. Default 480. |
value |
| height | Height of the drawing in pixels. Default 320. |
value |
| fixedAspectRatioScaling | Scale the drawing to the width of the box. On for a new drop; false for older views that don’t set it. |
value |
| scaleReferenceSize | Width at which the scaled drawing has its natural size. Default 384. |
value |
| hasLabelPadding | Leave room for the labels of the scale. Default true. |
value |
Properties
Section titled “Properties”Properties not covered in the sections above. These had no visible effect when this page was made:
| Name | Description | Property Type |
|---|---|---|
| legend | Show a legend. Default false. No useful effect with a single line. |
value |
| showTickMarks | Tickmarks on the chart axes. Default false. No visible effect. |
value |
| frameStyle | regular, flat, framed or instrument. Default regular. No visible effect. |
value |
| hasXTicksLimit | Whether xTicksLimit is set. Default false. |
value |
| xTicksLimit | Most labels on the time axis. No visible effect: there is no time axis. | value |
| hasXStepSize | Whether xStepSize is set. Default false. |
value |
| xStepSize | Distance between labels on the time axis. No visible effect. | value |
| hasYTicksLimit | Whether yTicksLimit is set. Default false. |
value |
| yTicksLimit | Most labels on the scale. No visible effect. | value |
| style | Standard Perspective style object. | object |
Common Properties
Section titled “Common Properties”These work in the same way on every maritime instrument, and are described in Maritime Instruments — Common Features:
- State —
state. - Priority —
priority. - Setpoint —
hasSetpoint,setpoint,autoAtSetpoint,autoAtSetpointDeadband,atSetpoint,touching,hasNewSetpoint,newSetpoint,animateSetpoint,setpointAtZeroDeadband,setpointOverride. - Advice Zones —
advicewithhasAdvice(see above). - Style and Events —
style.
Component Events
Section titled “Component Events”The Gauge Trend has no component events of its own.
Examples
Section titled “Examples”Example 1 — Engine Load over the Last Hour
Section titled “Example 1 — Engine Load over the Last Hour”- Drop a Gauge Trend into the view and make it 480 × 320 px. Leave
widthandheightat480and320. - Bind
datato a Tag History binding on[default]Engine/ME1/Load, over the last hour, returned as a dataset. - Set
hasScaletotrue,hasPrimaryTickmarkIntervaltotrueandprimaryTickmarkIntervalto25. - Set
hasValuetotrueand bindvalueto[default]Engine/ME1/Load. - Set
chartFilltotrue.
Found an error or something unclear?
Tell us what is wrong, confusing or missing on this page.
Built on the OpenBridge Design System