Gauge Trend Indicator
The Gauge Trend Indicator is a small symbol that shows the recent history of a value as a line, and the current value at its right edge. It is found in the Maritime - OpenBridge section of the Perspective Component Palette as Gauge Trend Indicator.
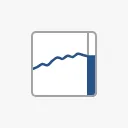
It is the indicator form of the Gauge Trend, for overviews where the full trend is shown elsewhere. See Instruments and Indicators.
A Gauge Trend Indicator dropped from the palette has no data and shows an empty frame:
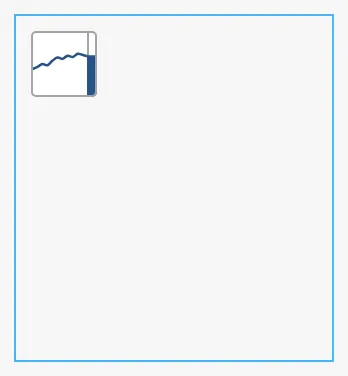
The indicator has a fixed size of 48 × 48 px and sits at the top left of the component’s box; it does not grow with the box. A new component has a box of 158 × 172 px, much larger than the symbol. Make the box 48 × 48 px. The blue frame is the component’s box:
Data and Value
Section titled “Data and Value”data is a list of numbers, oldest first, for example
[42, 45, 50, 48, 55, 60, 58, 63, 61, 66, 64, 62]. They are drawn as a smooth
line, evenly spaced from left to right; there is no time axis. minValue and
maxValue are the bottom and top of the frame.
The bar or dot at the right edge shows the current value. It is the last number
in data, unless hasValue is true: then it is value.
Last number in data (62) |
value = 90 |
|---|---|
|
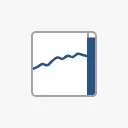 |
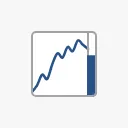
chartMinValue and chartMaxValue give the line its own range, so that small
changes show; the value at the edge keeps using minValue and maxValue. In
this image the line is drawn from 40 to 70:
Properties
Section titled “Properties”| Name | Description | Property Type |
|---|---|---|
| data | The history, a list of numbers, oldest first. Empty by default. | array |
| minValue | Value at the bottom of the frame. Default 0. |
value |
| maxValue | Value at the top of the frame. Default 100. |
value |
| hasChartMinValue | Give the line its own lower limit. Default false. |
value |
| chartMinValue | Lower limit of the line. Only shown when hasChartMinValue is true. |
value |
| hasChartMaxValue | Give the line its own upper limit. Default false. |
value |
| chartMaxValue | Upper limit of the line. Only shown when hasChartMaxValue is true. |
value |
| hasValue | Show value at the edge instead of the last number in data. Default false. |
value |
| value | The current value. Only shown when hasValue is true. |
value |
type selects how the current value is shown:
Fill (default) |
Point |
|---|---|
|
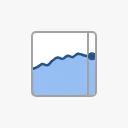 |
Fill— a bar at the right edge, filled up to the value.Point— a dot at the value, with the area under the line filled.
Properties
Section titled “Properties”| Name | Description | Property Type |
|---|---|---|
| type | Fill or Point. Default Fill. |
value |
Properties
Section titled “Properties”Properties not covered in the sections above:
| Name | Description | Property Type |
|---|---|---|
| style | Standard Perspective style object. | object |
The indicator has no state or priority.
Component Events
Section titled “Component Events”The Gauge Trend Indicator has no component events of its own.
Examples
Section titled “Examples”Example 1 — Last Hour of a Tag
Section titled “Example 1 — Last Hour of a Tag”- Drop a Gauge Trend Indicator into the view and make it 48 × 48 px.
- Bind
datato a script transform on a tag history binding that returns the values as a plain list of numbers, for example the last 30 one-minute averages of[default]Engine/ME1/Load. - Set
maxValueto100.
Found an error or something unclear?
Tell us what is wrong, confusing or missing on this page.
Built on the OpenBridge Design System