Bar Horizontal
The Bar Horizontal shows a value as a horizontal bar with a scale beside it. It is the building block the OpenBridge charts use for their axes, and works on its own as a compact level indicator in a dashboard. It is found in the Chart - OpenBridge section of the Perspective Component Palette as Bar Horizontal. It is marked (Beta), because the upstream component is.
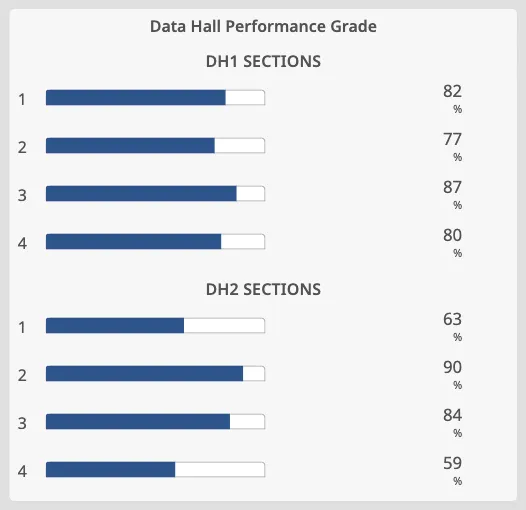
The bar is as wide as the component: resize the component to make the bar longer or shorter. Tickmarks and labels keep their size, so a longer bar gets more room between them rather than larger text. The bar and scale take a fixed height; make the component’s height large enough to show the labels.
Value and Range
Section titled “Value and Range”| Name | Description | Property Type |
|---|---|---|
| value | The value the bar is filled up to. Default 50. |
value |
| minValue | Lowest value of the scale. Default 0. |
value |
| maxValue | Highest value of the scale. Default 100. |
value |
| priority | regular (default) or enhanced, which draws the bar and setpoint in the blue instrument colours. |
value |
| Name | Description | Property Type |
|---|---|---|
| hasScale | Show the tickmarks. Default true. |
value |
| side | Side of the bar the scale is drawn on: bottom (default) or top. |
value |
| showLabels | Label the primary tickmarks. Default true. |
value |
| primaryTickmarkInterval | Interval of the long, labelled tickmarks. Shown when hasPrimaryTickmarkInterval is on (default on, 20). |
value |
| secondaryTickmarkInterval | Interval of the medium tickmarks. Shown when hasSecondaryTickmarkInterval is on (default on, 10). |
value |
| tertiaryTickmarkInterval | Interval of the short tickmarks. Shown when hasTertiaryTickmarkInterval is on (default off, 5). |
value |
| paddingLeft | Space left of the scale, in px, that keeps the end labels inside the component. Default 16. |
value |
| paddingRight | Space right of the scale, in px. Default 16. |
value |
The interval properties only appear in the Property Editor while their has…
toggle is on, and the secondary and tertiary toggles only while hasScale is
on. For a slim bar without a scale — as in a list of percentages — set
hasScale and showLabels to false.
Advice Zones
Section titled “Advice Zones”advices is a list of ranges drawn along the scale, each with min, max,
type (advice or caution) and hinted (draw the range dimmed). See
Advice Zones.
advicePosition sets where the ranges are drawn: center (inside the bar,
default), inner (over the short tickmarks) or outer (beside the scale,
without overlapping it).
Setpoint
Section titled “Setpoint”Turn on hasSetpoint to show a setpoint marker at setpoint. The other
setpoint properties only appear while hasSetpoint is on:
| Name | Description | Property Type |
|---|---|---|
| setpoint | Value of the setpoint marker. Default 50. |
value |
| autoAtSetpoint | Work out whether the value is at the setpoint from autoAtSetpointDeadband. Default true. |
value |
| autoAtSetpointDeadband | How close the value must be to the setpoint to count as at setpoint. Default 1. |
value |
| atSetpoint | Whether the value is at the setpoint. Appears when autoAtSetpoint is false. |
value |
See Setpoint for how the marker looks in each state.
style works as on the maritime instruments; see
Style and Events.
Component Events
Section titled “Component Events”The Bar Horizontal has no component events of its own.
Example
Section titled “Example”A list of section grades: each row is a flex container with a Label, a Bar
Horizontal and a Readout. The bar has hasScale and showLabels off, and
value bound to the grade.
Found an error or something unclear?
Tell us what is wrong, confusing or missing on this page.
Built on the OpenBridge Design System