Wind
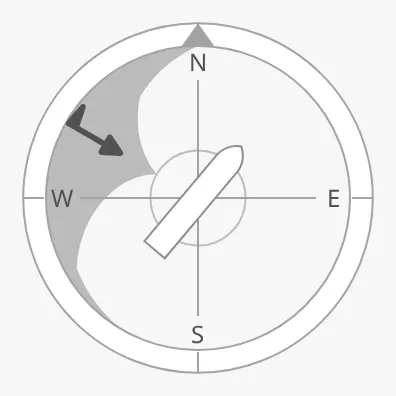
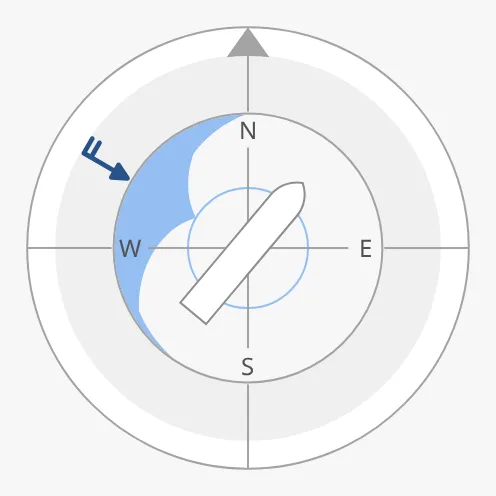
The Wind instrument shows the wind on a compass dial: where it comes from, how strong it is, and — as a shaded area — where it has come from over a period. The vessel is drawn in the centre, turned to its heading. It is found in the Maritime - OpenBridge section of the Perspective Component Palette as Wind.
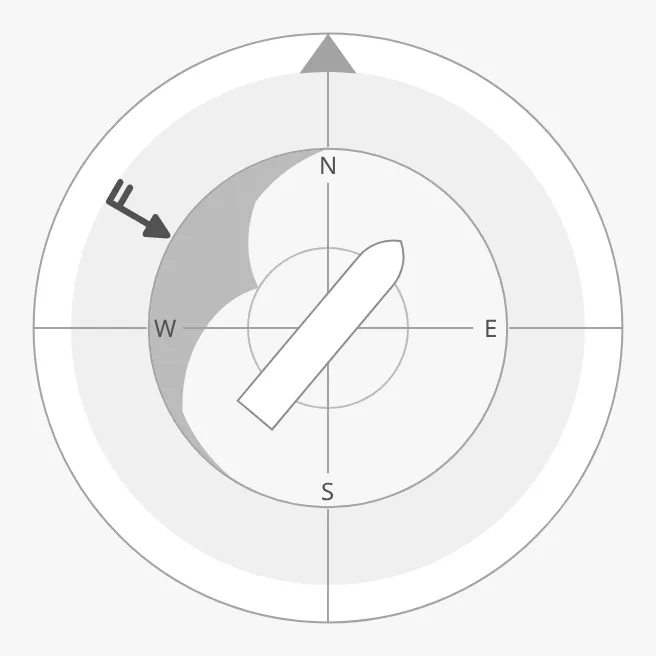
The parts of the instrument:
- Dial — north up, with N, E, S and W marked. See Size and Variant.
- Wind arrow — points from the direction the wind comes from; the barbs show the speed. See Wind.
- Histogram — the shaded area: how often the wind has come from each direction. See Histogram.
- Vessel — turned to the heading. See Vessel.
The Wind is one of the maritime instruments. It has priority as described
in Maritime Instruments — Common Features, but no
state, setpoint, advice zones or scale properties. For a small symbol of the
wind, see the Wind Indicator.
A Wind dropped from the palette is 509 × 509 px and shows a wind of 25 knots from the north, with no histogram and the vessel heading north (shown smaller here):
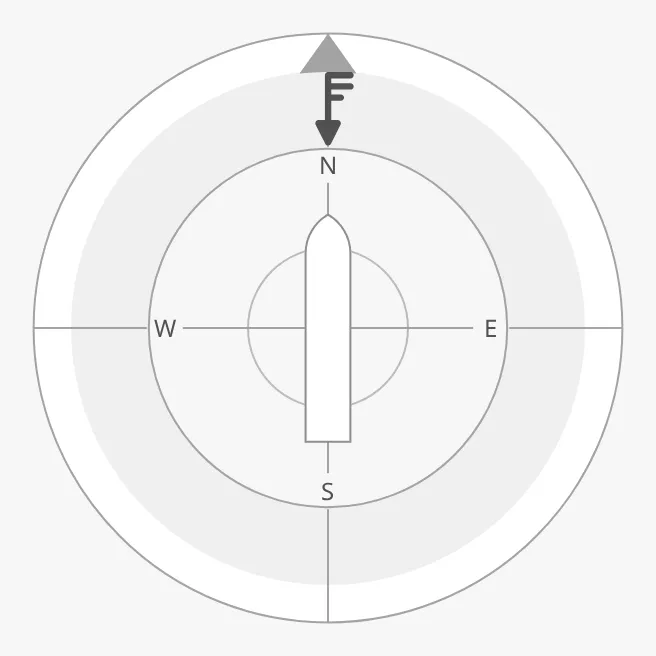
Bind currentWindFromDirection to the direction the wind comes from, in
degrees (0 is north, 90 east), and currentWindSpeedKnots to its speed in
knots. The arrow sits on the dial at the direction the wind comes from and
points towards the centre.
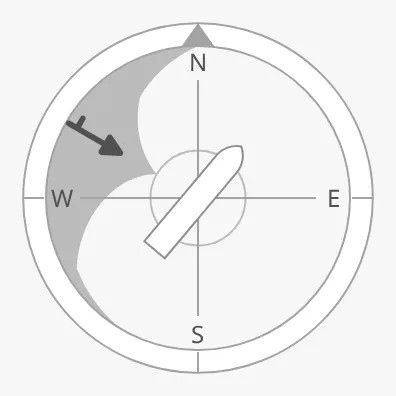
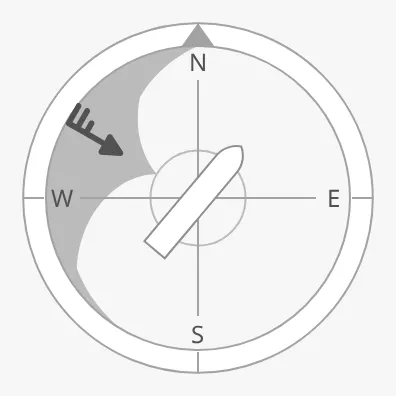
The speed is shown with wind barbs, as on a weather chart: a short barb is 5 knots, a long barb 10 knots and a flag 50 knots.
| 5 knots | 25 knots | 50 knots |
|---|---|---|
 |
 |
 |
Whether this is the true or the apparent wind is up to you: the instrument shows the values it is given. The dial is always north up, so for a true wind give the true direction.
Properties
Section titled “Properties”| Name | Description | Property Type |
|---|---|---|
| currentWindFromDirection | Direction the wind comes from, in degrees; 0 is north. Default 0. |
value |
| currentWindSpeedKnots | Wind speed in knots, shown by the barbs on the arrow. Default 25. |
value |
Histogram
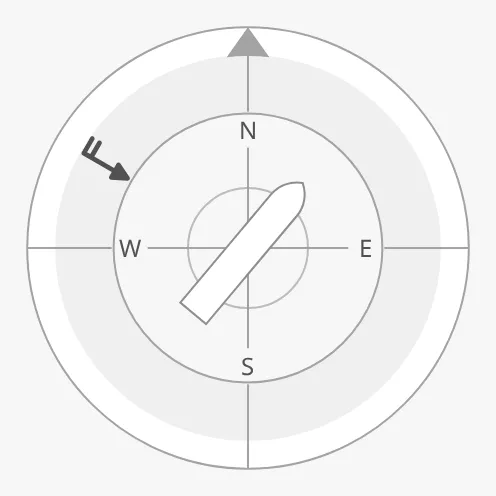
Section titled “Histogram”The shaded area inside the dial shows how often the wind has come from each direction, for example over the last hour. It grows from the ring towards the centre: the deeper it reaches, the more often the wind came from that direction.
| No histogram (default) | With windHistogramData |
|---|---|
 |
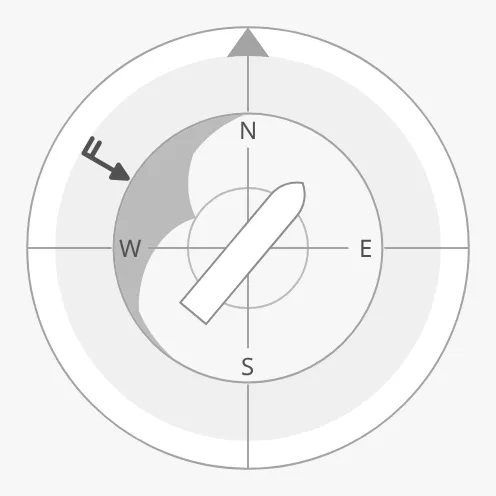 |
windHistogramData is a list of objects, one per direction:
| Name | Description | Property Type |
|---|---|---|
| direction | Direction the wind came from, in degrees. | value |
| occurrences | How often, or how long, the wind came from that direction. Any unit. | value |
Only the proportions matter: the direction with the most occurrences reaches furthest in, and the others are scaled to it. Between two entries the value changes evenly, and the last entry joins the first across north, so give entries at even steps (every 10° or 30°) all the way round. The image above was drawn from:
[ {"direction": 0, "occurrences": 0}, {"direction": 30, "occurrences": 0}, {"direction": 60, "occurrences": 0}, {"direction": 90, "occurrences": 0}, {"direction": 120, "occurrences": 0}, {"direction": 150, "occurrences": 0}, {"direction": 180, "occurrences": 0}, {"direction": 210, "occurrences": 0}, {"direction": 240, "occurrences": 4}, {"direction": 270, "occurrences": 20}, {"direction": 300, "occurrences": 35}, {"direction": 330, "occurrences": 12}]Build the list in a script or a query from the logged wind direction, and bind
it to windHistogramData.
Visualization
Section titled “Visualization”visualization selects what is drawn inside the dial:
histogram (default) |
forceGraphics |
|---|---|
|
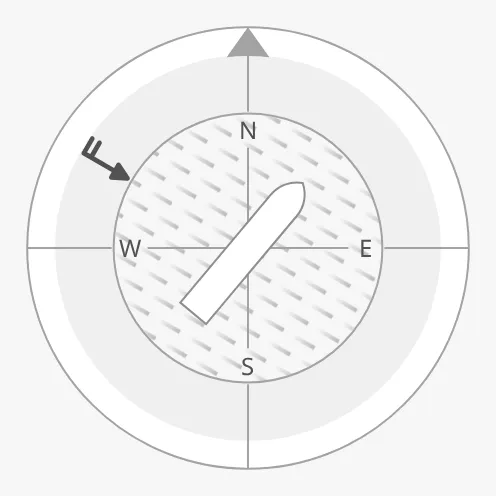 |
forceGraphics fills the dial with streaks in the direction of the current
wind instead of the histogram. windHistogramData is not used then.
Properties
Section titled “Properties”| Name | Description | Property Type |
|---|---|---|
| windHistogramData | Wind directions over a period, as a list of direction and occurrences. |
array |
| visualization | histogram or forceGraphics. Default histogram. |
value |
Vessel
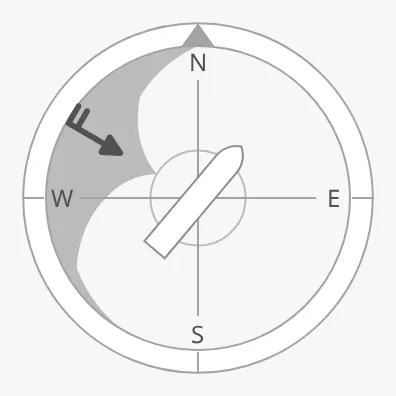
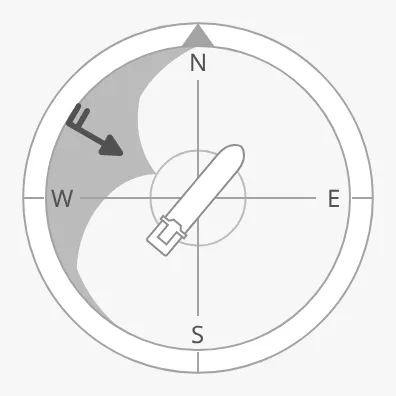
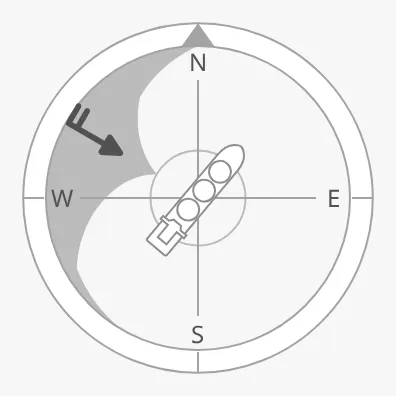
Section titled “Vessel”The vessel in the centre is turned to vesselHeadingDeg, in degrees. Bind it to
the heading so the operator sees the wind relative to the bow. vesselImage
selects the drawing; use one of the -top images, which show the vessel from
above:
generic-top (default) |
cargo-top |
tanker-top |
|---|---|---|
 |
 |
 |
The same vessel images are offered as on the Compass, including
car-ferry-top, psv-top, sov-top, fishing-vessel-top, cargo-wind-top
and drones. The small variant draws no vessel.
Properties
Section titled “Properties”| Name | Description | Property Type |
|---|---|---|
| vesselHeadingDeg | Heading of the vessel in degrees; turns the vessel. Default 0. |
value |
| vesselImage | Drawing of the vessel. Default generic-top. |
value |
| vesselImageSrc | Your own vessel image instead of vesselImage. See Custom Vessel Image. |
object |
Size and Variant
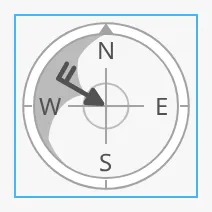
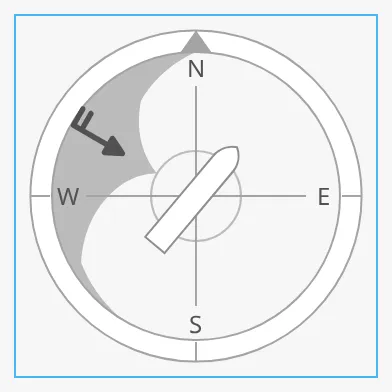
Section titled “Size and Variant”The instrument fills the component’s box and is centred in it; in a box that is not square it takes the size of the shorter side. The blue frame is the component’s box:
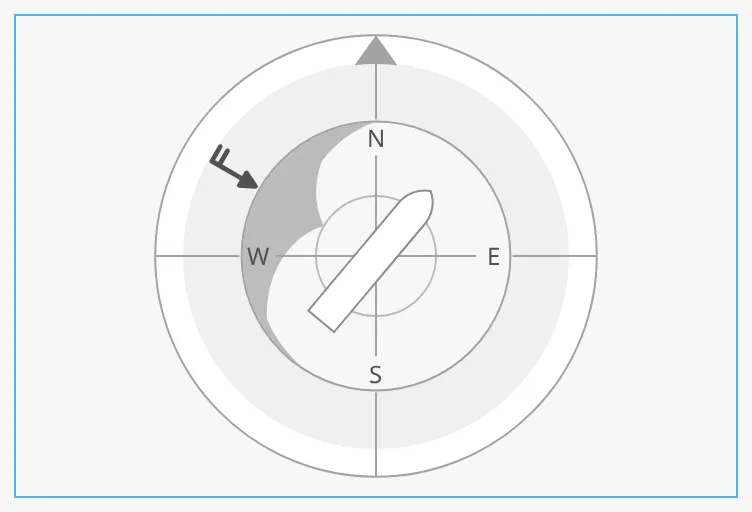
variant selects how much is drawn, to suit the size:
| variant | ||
|---|---|---|
small |
One ring, the arrow in the centre and no vessel. For boxes under about 100 px. | 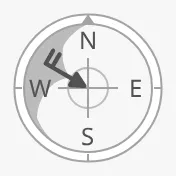 |
medium |
One ring with the vessel in the centre. | 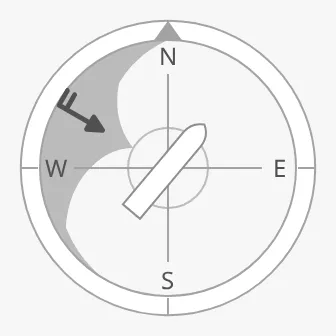 |
large |
Two rings, the arrow between them and the histogram inside the inner ring. | |
auto (default) chooses the variant from the size of the box: small below
smallVariantMaxPx (96 px by default), medium below mediumVariantMaxPx
(200 px), and large above. Change the thresholds to move the steps, or set
variant to the variant you want.
auto, 90 px box |
auto, 180 px box |
|---|---|
 |
 |
Properties
Section titled “Properties”| Name | Description | Property Type |
|---|---|---|
| variant | auto, small, medium or large. Default auto. |
value |
| smallVariantMaxPx | With auto: boxes smaller than this (the shorter side, in px) get small. Default 96. |
value |
| mediumVariantMaxPx | With auto: boxes smaller than this get medium, larger ones large. Default 200. |
value |
Priority
Section titled “Priority”priority set to enhanced draws the arrow and the histogram in the enhanced
colours. See Priority.
regular (default) |
enhanced |
|---|---|
|
 |
Common Properties
Section titled “Common Properties”These work in the same way on every maritime instrument, and are described in Maritime Instruments — Common Features:
- Priority —
priority. - Style and Events —
style.
Component Events
Section titled “Component Events”The Wind has no component events of its own.
Examples
Section titled “Examples”Example 1 — Wind Display with Heading
Section titled “Example 1 — Wind Display with Heading”- Drop a Wind into the view and make it 320 × 320 px.
- Set
varianttolarge. - Bind
currentWindFromDirectionto[default]Weather/TrueWindDirectionandcurrentWindSpeedKnotsto[default]Weather/TrueWindSpeed. - Bind
vesselHeadingDegto[default]Navigation/Heading. - Bind
windHistogramDatato a script transform or named query that counts the logged wind directions of the last hour in 30° steps, giving a list like the one in Histogram.
Found an error or something unclear?
Tell us what is wrong, confusing or missing on this page.
Built on the OpenBridge Design System