Graph Mini
The Graph Mini is a small trend symbol: a line graph of recent values in a 32 × 32 px frame, with a dot at the latest value. Use it beside a readout or in a list to show whether a value is rising or falling. It is found in the Chart - OpenBridge section of the Perspective Component Palette as Graph Mini (Beta).
Note: This component is in beta: its properties may change in a later version.
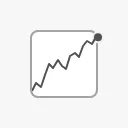
- Frame — the 32 × 32 px background of the graph.
- Line — the values in
data. See Data. - Dot — the latest value, on the right edge of the frame.
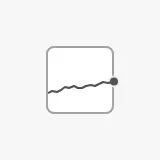
A Graph Mini dropped from the palette has no data and shows an empty frame, with the dot at the bottom. The blue frame is the component’s box:

For a trend graph that grows with its box, see the Indicator Graph.
data holds the points of the graph. It can be:
-
an object with two lists of the same length,
xValues(the time or position of each point) andyValues(the values), for example{"xValues": [0, 1, 2, 3, 4, 5, 6, 7],"yValues": [12, 13, 12.5, 14, 15.5, 15, 16, 15.2]} -
a dataset, for example from a Tag History binding. The first date column (or else the first column) is the time, and the first other column that is not a date is the value. A dataset with a single value column is drawn against the row number;
-
a list of objects with
xandy; -
a list of numbers, which are the values in order.
The points are placed from left to right by their xValues, so uneven gaps in
time show as uneven gaps in the line. The last value is marked with the dot.
| Trend | |
|---|---|
| Rising | 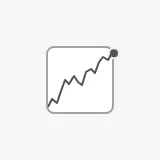 |
| Falling | 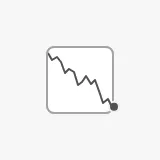 |
| Dip |  |
Note: The images on this page were made with the object form of
data. The dataset form was not tried for this page.
Properties
Section titled “Properties”| Name | Description | Property Type |
|---|---|---|
| data | The points: an object with xValues and yValues, a dataset, or a list of points or numbers. Empty lists by default. |
object |
By default the vertical range follows the data: from a little below the lowest
value to a little above the highest, so even a small change fills the frame.
Set hasMinY and minY, and hasMaxY and maxY, to fix the bottom and top
of the range, so that the slope shows the size of the change. minY is only
shown when hasMinY is true, and maxY only when hasMaxY is true.
The values 12 to 19 with three ranges:
| Range | |
|---|---|
| Automatic (default) | |
hasMinY = true, minY = 0 |
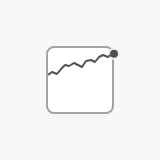 |
hasMinY, hasMaxY = true, minY = 0, maxY = 40 |
 |
Properties
Section titled “Properties”| Name | Description | Property Type |
|---|---|---|
| hasMinY | Fix the bottom of the range at minY. Default false. |
value |
| minY | Value at the bottom of the frame. Default 0. Only shown when hasMinY is true. |
value |
| hasMaxY | Fix the top of the range at maxY. Default false. |
value |
| maxY | Value at the top of the frame. Default 0. Only shown when hasMaxY is true. |
value |
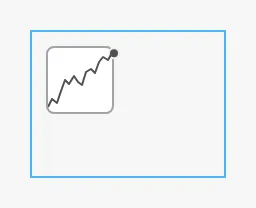
The Graph Mini has a fixed size of 48 × 48 px, with the 32 × 32 px frame in the middle, and sits at the top left of the component’s box. It does not grow with the box. A new component has a box of 48 × 48 px; keep it at that size. The blue frame is a box of 96 × 72:
The colours follow the OpenBridge palette of the session:

Component Events
Section titled “Component Events”The Graph Mini has no component events of its own.
Examples
Section titled “Examples”Example 1 — Trend of the Last Hour beside a Readout
Section titled “Example 1 — Trend of the Last Hour beside a Readout”- Drop a Graph Mini beside the readout of the value, with a box of 48 × 48.
- Add a Tag History binding to
data, for the tag[default]Pump01/Pressure, a Realtime range of 60 minutes and a polling rate of, for example, 10 seconds. - Leave
hasMinYandhasMaxYoff to see every small change, or sethasMinYtotrue,minYto0,hasMaxYtotrueandmaxYto the top of the measuring range (for example10) to see how large the change is.
The binding returns a dataset with a date column (t_stamp) and a value
column, which the Graph Mini reads as time and value.
Note: This example was written from the component’s code and was not tried in a gateway.
Found an error or something unclear?
Tell us what is wrong, confusing or missing on this page.
Built on the OpenBridge Design System