Velocity Projection Plot
The Velocity Projection Plot is a polar plot for vessels with wind-assisted propulsion. Around the vessel it shows, for each direction sector, the energy the voyage needs and how much of it the wind can provide, together with the current wind and sea current. It is found in the Maritime - OpenBridge section of the Perspective Component Palette as Velocity Projection Plot (Experimental).
Note: This component is experimental: its properties may change in a later version.
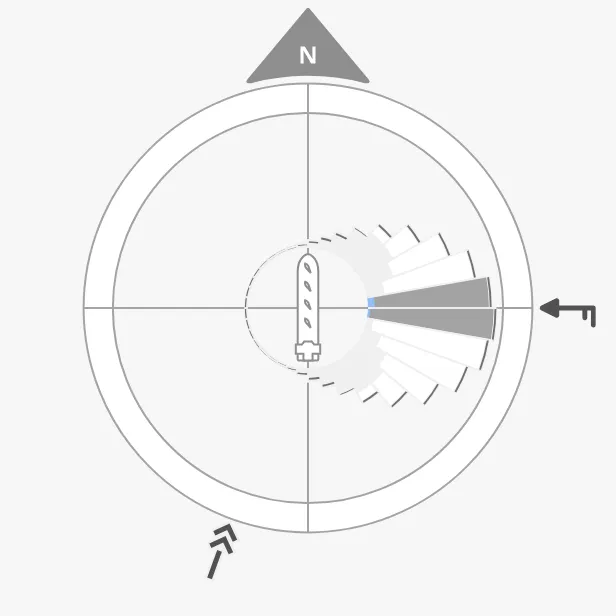
The parts of the plot:
- Dial — a ring with north marked at the top and the vessel in the centre. See Vessel.
- Sectors — one wedge per direction sector. See Sectors.
- Wind and current arrows — outside the ring. See Wind and Current.
The plot draws the values it is given; it does not calculate them. The sector data come from a route or energy optimisation system.
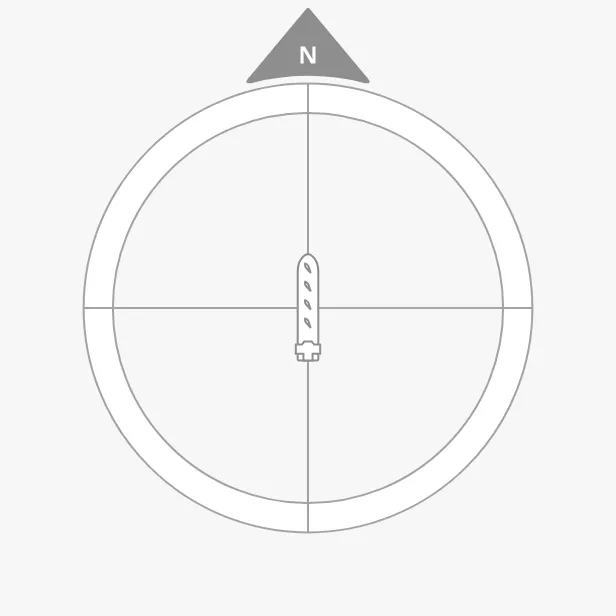
A Velocity Projection Plot dropped from the palette is 509 × 511 px and shows the empty dial and the vessel (shown smaller here):
Sectors
Section titled “Sectors”dataPoints is a list of sectors, each an object:
| Name | Description | Property Type |
|---|---|---|
| startAngleDeg | Start of the sector, in degrees; 0 is north, counted clockwise. | value |
| endAngleDeg | End of the sector, in degrees. | value |
| ratioTotalEnergy | The total energy of the sector. Sets the length of the wedge, relative to the longest one. | value |
| ratioWindEnergyOrExcessSpeed | The part of that energy the wind provides, from 0 to 1: that part of the wedge is filled. Above 1, the excess is drawn as a band beyond the end of the wedge. |
value |
Only the proportions of ratioTotalEnergy matter: the longest wedge reaches
the same radius whatever the numbers. Give sectors that together go all the way
round, for example 36 sectors of 10° or 12 of 30°.
| Sectors only | With the current wind |
|---|---|
 |
|
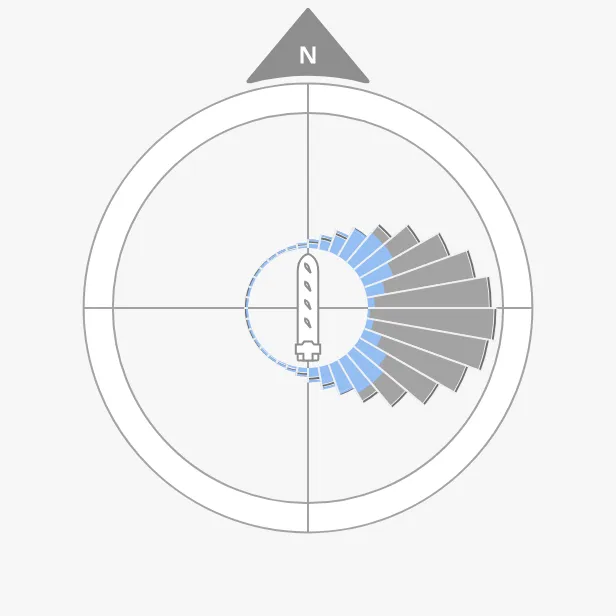
The sector that contains currentWindFromDirection is highlighted: drawn
in darker colours, with the wind part in the enhanced colour. A direction on
the border between two sectors highlights both. The other sectors are drawn in
light colours.
Without a wind direction every sector is highlighted, as in the left image: the upstream component’s “average” view.
Properties
Section titled “Properties”| Name | Description | Property Type |
|---|---|---|
| dataPoints | The sectors, as a list of the objects above. Default empty. | array |
Wind and Current
Section titled “Wind and Current”The wind and the current are drawn as arrows outside the ring, on the side they come from, as on the Compass.
- Wind —
currentWindFromDirectionis the direction the wind comes from, in degrees, andcurrentWindSpeedKnotsits speed in knots, shown by the barbs on the arrow (a long barb is 10 knots, a short one 5). - Current —
currentFromDirectionis the direction the current comes from.currentSpeedKnotsis rounded and used as the number of arrow heads, from0to4: it is a measure of strength rather than a speed.
Properties
Section titled “Properties”| Name | Description | Property Type |
|---|---|---|
| currentWindFromDirection | Direction the wind comes from, in degrees. Selects the highlighted sector. Empty by default. | value |
| currentWindSpeedKnots | Wind speed in knots. Empty by default. | value |
| currentFromDirection | Direction the current comes from, in degrees. Empty by default. | value |
| currentSpeedKnots | Strength of the current: 0 to 4 arrow heads. Empty by default. |
value |
Vessel
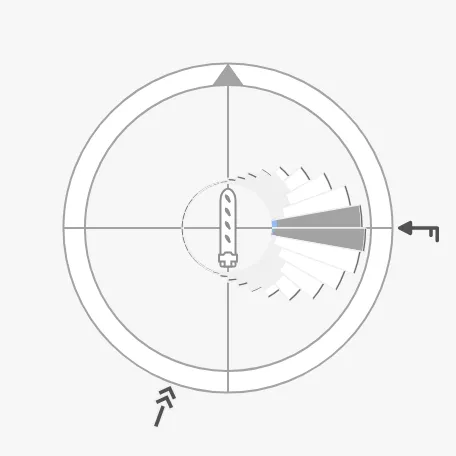
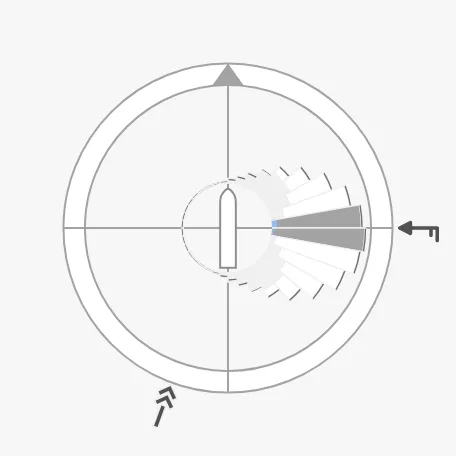
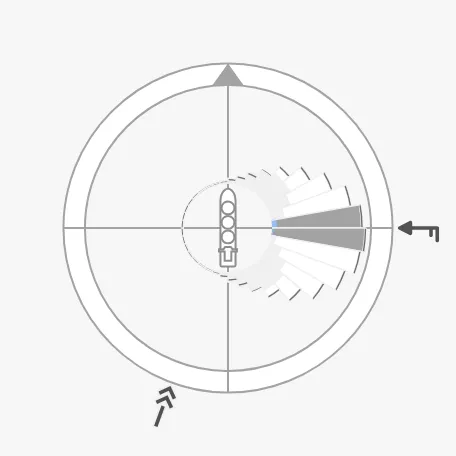
Section titled “Vessel”The vessel in the centre always points up. vesselImage selects the drawing;
use one of the -top images:
cargo-wind-top (default) |
generic-top |
|---|---|
 |
 |
tanker-top |
|---|
 |
Properties
Section titled “Properties”| Name | Description | Property Type |
|---|---|---|
| vesselImage | Drawing of the vessel. Default cargo-wind-top. |
value |
| vesselImageSrc | Your own vessel image instead of vesselImage. See Custom Vessel Image. |
object |
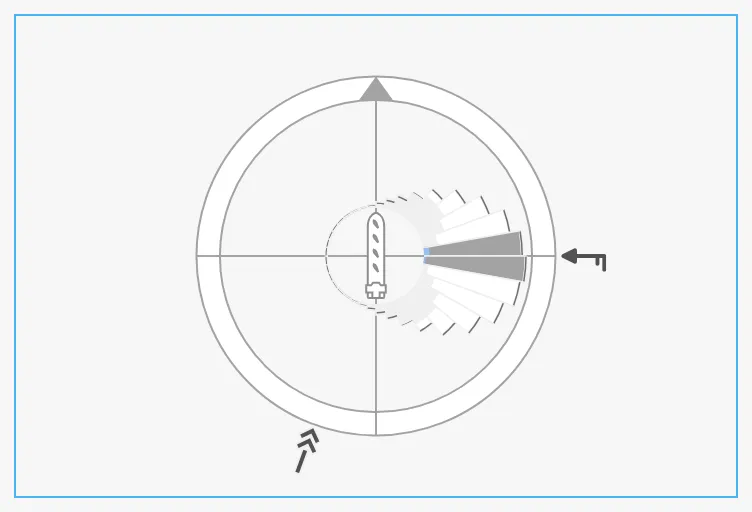
The plot fills the component’s box and is centred in it; in a box that is not square it takes the size of the shorter side. The blue frame is the component’s box:
Properties
Section titled “Properties”Properties not covered in the sections above:
| Name | Description | Property Type |
|---|---|---|
| style | Standard Perspective style object. | object |
Component Events
Section titled “Component Events”The Velocity Projection Plot has no component events of its own.
Examples
Section titled “Examples”Example 1 — Twelve Sectors
Section titled “Example 1 — Twelve Sectors”-
Drop a Velocity Projection Plot into the view and make it 300 × 300 px.
-
Set
dataPointsto twelve sectors of 30°:[{"startAngleDeg": 0,"endAngleDeg": 30,"ratioWindEnergyOrExcessSpeed": 0.2,"ratioTotalEnergy": 0.02},{"startAngleDeg": 30,"endAngleDeg": 60,"ratioWindEnergyOrExcessSpeed": 0.6,"ratioTotalEnergy": 0.04},{"startAngleDeg": 60,"endAngleDeg": 90,"ratioWindEnergyOrExcessSpeed": 1.1,"ratioTotalEnergy": 0.12},{"startAngleDeg": 90,"endAngleDeg": 120,"ratioWindEnergyOrExcessSpeed": 1.3,"ratioTotalEnergy": 0.2},{"startAngleDeg": 120,"endAngleDeg": 150,"ratioWindEnergyOrExcessSpeed": 1.1,"ratioTotalEnergy": 0.12},{"startAngleDeg": 150,"endAngleDeg": 180,"ratioWindEnergyOrExcessSpeed": 0.6,"ratioTotalEnergy": 0.04},{"startAngleDeg": 180,"endAngleDeg": 210,"ratioWindEnergyOrExcessSpeed": 0.2,"ratioTotalEnergy": 0.02},{"startAngleDeg": 210,"endAngleDeg": 240,"ratioWindEnergyOrExcessSpeed": 0.6,"ratioTotalEnergy": 0.04},{"startAngleDeg": 240,"endAngleDeg": 270,"ratioWindEnergyOrExcessSpeed": 1.1,"ratioTotalEnergy": 0.12},{"startAngleDeg": 270,"endAngleDeg": 300,"ratioWindEnergyOrExcessSpeed": 1.3,"ratioTotalEnergy": 0.2},{"startAngleDeg": 300,"endAngleDeg": 330,"ratioWindEnergyOrExcessSpeed": 1.1,"ratioTotalEnergy": 0.12},{"startAngleDeg": 330,"endAngleDeg": 360,"ratioWindEnergyOrExcessSpeed": 0.6,"ratioTotalEnergy": 0.04}] -
Bind
currentWindFromDirectionto[default]Weather/TrueWindDirectionandcurrentWindSpeedKnotsto[default]Weather/TrueWindSpeed. With the wind from 75° and 12 knots, it looks like this: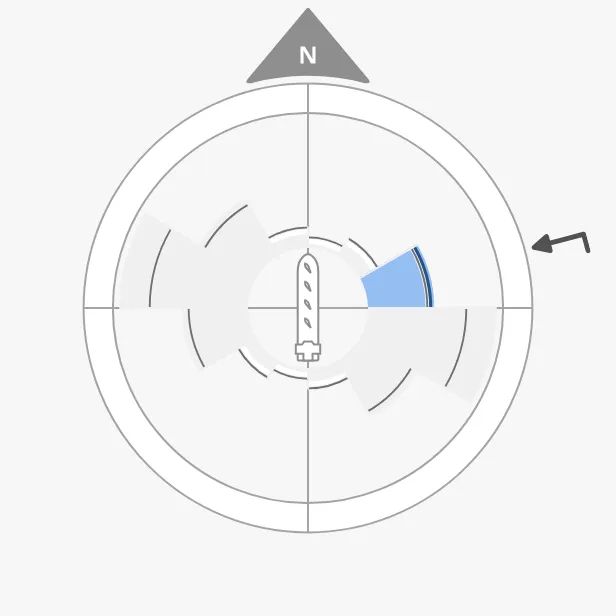
-
In a real system, bind
dataPointsto the output of the optimisation system instead of a fixed list.
Found an error or something unclear?
Tell us what is wrong, confusing or missing on this page.
Built on the OpenBridge Design System